
Compare Vivid Global with Similar Stocks
Dashboard
Weak Long Term Fundamental Strength with a -2.73% CAGR growth in Operating Profits over the last 5 years
- Company's ability to service its debt is weak with a poor EBIT to Interest (avg) ratio of 0.68
- The company has been able to generate a Return on Equity (avg) of 3.56% signifying low profitability per unit of shareholders funds
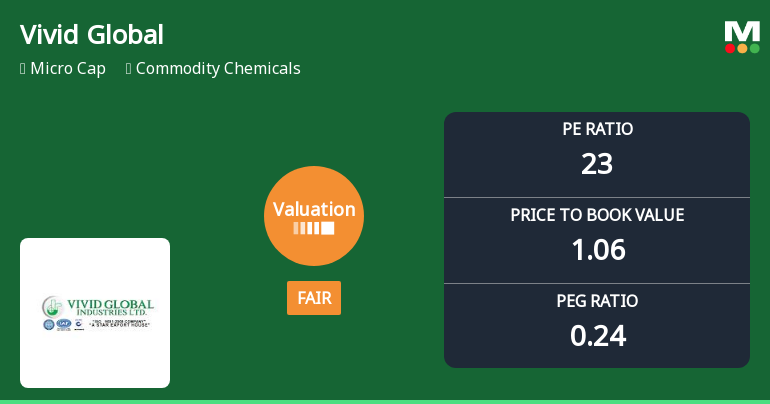
With ROE of 4.6, it has a Expensive valuation with a 1.1 Price to Book Value
Stock DNA
Commodity Chemicals
INR 17 Cr (Micro Cap)
23.00
46
0.00%
-0.21
4.62%
1.06
Total Returns (Price + Dividend) 
Latest dividend: 0.20206540447504306 per share ex-dividend date: Sep-21-2021
Risk Adjusted Returns v/s
Returns Beta

News
Vivid Global Industries Ltd Valuation Shifts Signal Renewed Price Attractiveness
Vivid Global Industries Ltd, a micro-cap player in the commodity chemicals sector, has seen its valuation parameters adjust notably, shifting from expensive to fair territory. This re-rating comes amid a challenging market environment and a significant price correction, prompting a downgrade in its Mojo Grade from Hold to Sell as of 6 July 2026.
Read full news article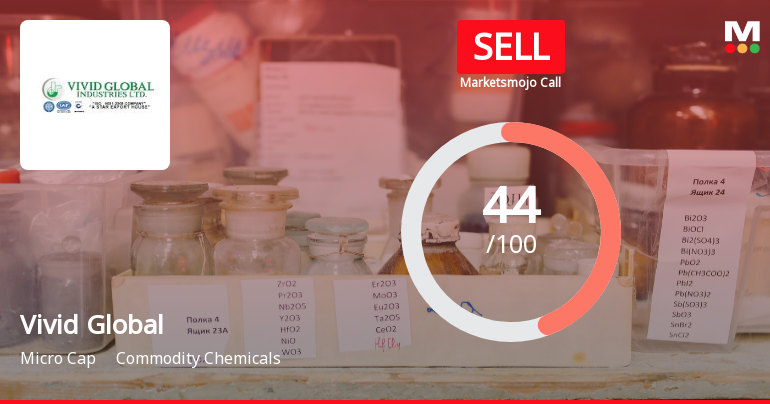
Vivid Global Industries Ltd Downgraded to Sell Amid Mixed Financial and Technical Signals
Vivid Global Industries Ltd, a micro-cap player in the commodity chemicals sector, has seen its investment rating downgraded from Hold to Sell as of 6 July 2026. This shift reflects a complex interplay of technical indicators, valuation metrics, financial trends, and quality assessments that collectively signal caution for investors despite some recent positive performance.
Read full news article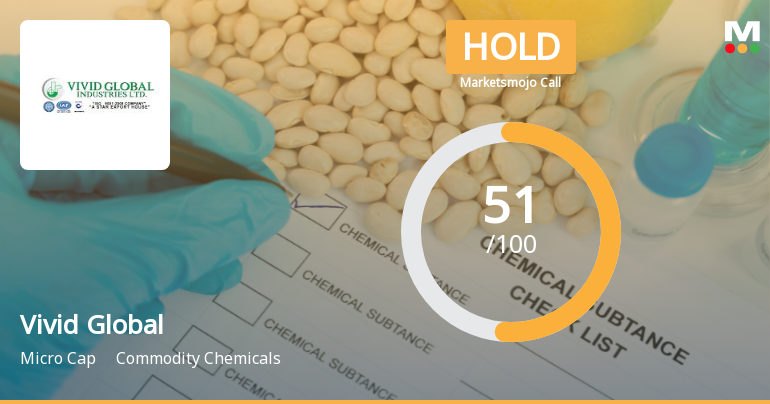
Vivid Global Industries Ltd Upgraded to Hold on Technical and Financial Improvements
Vivid Global Industries Ltd, a micro-cap player in the commodity chemicals sector, has seen its investment rating upgraded from Sell to Hold as of 23 June 2026. This change reflects a notable improvement in the company’s technical indicators, alongside positive financial trends and a more balanced valuation profile, signalling cautious optimism among investors despite some lingering fundamental challenges.
Read full news article Announcements
Compliances-Certificate under Reg. 74 (5) of SEBI (DP) Regulations 2018
10-Jul-2026 | Source : BSESubmission of Certificate under Regulation 74(5) of SEBI (Depositories & Participants) Regulations 2018 for the quarter ended 30.06.2026
Closure of Trading Window
27-Jun-2026 | Source : BSEPursuant to provisions of SEBI (Prohibition of Insider Trading) Regulations 2015 as amended from time to time and Vivid Global Industries Limiteds Code of conduct for Insiders the Trading window for dealing in securities of the company shall remain closed for Designated Persons (as defined in the Code) including their immediate relatives with effect from 01st July 2026 till 48 hours after the announcement of the Un-Audited Financial Results of the Company for the quarter ended on 30th June 2026.
Board Meeting Outcome for Outcome Of The Board Meeting Held On 22Nd May 2026. Disclosure Under Regulation 30 Of The SEBI (Listing Obligations And Disclosure Requirements) Regulations 2015
22-May-2026 | Source : BSEThe Board of Directors in its meeting held on 22nd May 2026 at 04.00 p.m. inter-alia approved the following: 1. Audited Financial Statement of Accounts for the quarter and year ended on 31st March 2026 the audited Statement of Assets and Liabilities and the audited Cash Flow Statement as at that date along with Independent Auditors Report thereon. The Board Meeting concluded at 4:35 p.m. Kindly take the above in your records and acknowledge the receipt of the same.
Corporate Actions

No Upcoming Board Meetings

Vivid Global Industries Ltd has declared 4% dividend, ex-date: 21 Sep 21

Vivid Global Industries Ltd has announced 5:10 stock split, ex-date: 02 Dec 15

No Bonus history available

No Rights history available
Quality key factors
Valuation key factors
Technicals key factors
 Technical Indicator Scale: Bearish, Mildly Bearish, Sideways, Mildly Bullish, Bullish Turned
 Shareholding Snapshot : Mar 2026
Shareholding Compare (%holding)
Non Institution
None
Held by 0 Schemes
Held by 0 FIIs
Sumish S Mody (18.98%)
Sumiran Sumish Mody (2.9%)
44.87%
Quarterly Results Snapshot (Standalone) - Mar'26 - QoQ

QoQ Growth in quarter ended Mar 2026 is -0.88% vs 5.82% in Dec 2025

QoQ Growth in quarter ended Mar 2026 is 42.11% vs 11.76% in Dec 2025
Half Yearly Results Snapshot (Standalone) - Sep'25
Growth in half year ended Sep 2025 is 20.92% vs 31.30% in Sep 2024
Growth in half year ended Sep 2025 is 58.82% vs 240.00% in Sep 2024
Nine Monthly Results Snapshot (Standalone) - Dec'25
YoY Growth in nine months ended Dec 2025 is 40.43% vs 14.06% in Dec 2024
YoY Growth in nine months ended Dec 2025 is 76.92% vs 225.00% in Dec 2024
Annual Results Snapshot (Standalone) - Mar'26
YoY Growth in year ended Mar 2026 is 31.11% vs 19.21% in Mar 2025
YoY Growth in year ended Mar 2026 is 87.18% vs 116.67% in Mar 2025
About Vivid Global Industries Ltd

Company Coordinates


