
Compare VL E-Governance with Similar Stocks
Dashboard
With a Operating Losses, the company has a Weak Long Term Fundamental Strength
- Company's ability to service its debt is weak with a poor EBIT to Interest (avg) ratio of -3.32
- The company has reported losses. Due to this company has reported negative ROCE
Negative results in Mar 26
Risky - Negative EBITDA
Underperformed the market in the last 1 year
Stock DNA
Computers - Software & Consulting
INR 152 Cr (Micro Cap)
NA (Loss Making)
20
0.00%
-0.07
-2.54%
3.33
Total Returns (Price + Dividend) 
VL E-Governance for the last several years.
Risk Adjusted Returns v/s
Returns Beta

News
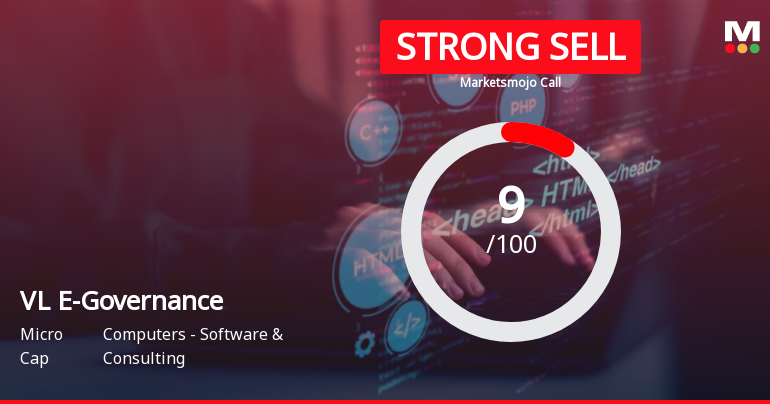
VL E-Governance & IT Solutions Ltd is Rated Strong Sell
VL E-Governance & IT Solutions Ltd is rated Strong Sell by MarketsMOJO. This rating was last updated on 08 July 2025. However, the analysis and financial metrics presented here reflect the company’s current position as of 15 June 2026, providing investors with the most recent and relevant data to assess the stock’s outlook.
Read full news article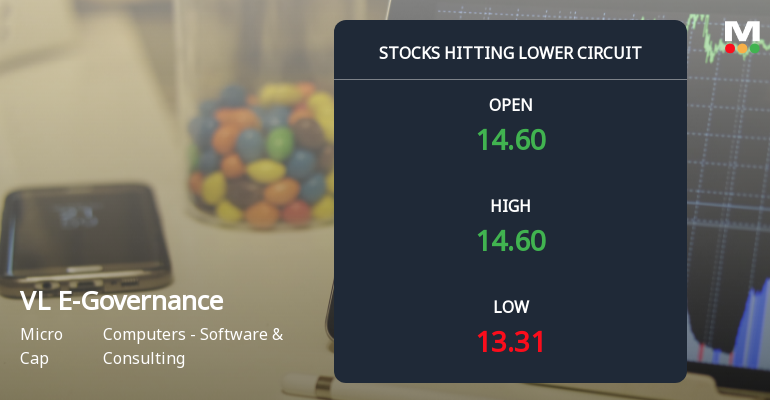
VL E-Governance & IT Solutions Ltd Locks at Lower Circuit With 4.96% Loss — Sellers Queue, No Buyers in Sight
At Rs 13.40, sellers were still queuing — but there were no buyers willing to take the other side. VL E-Governance & IT Solutions Ltd locked at its lower circuit of 4.96% on 2 Jun 2026, with unfilled sell orders and a frozen price, reflecting persistent supply pressure in a micro-cap stock.
Read full news article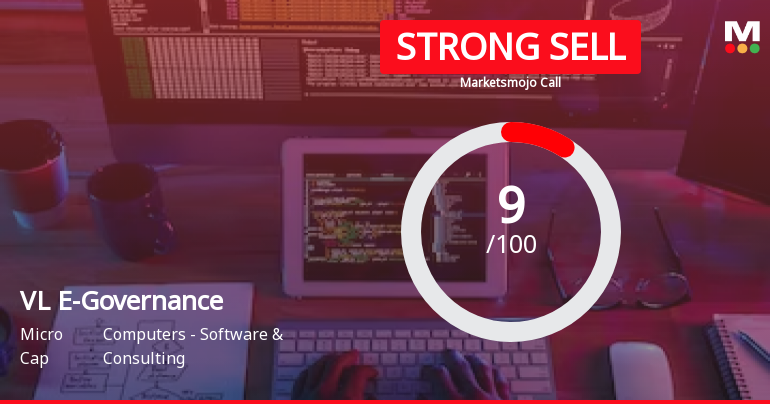
VL E-Governance & IT Solutions Ltd is Rated Strong Sell
VL E-Governance & IT Solutions Ltd is rated Strong Sell by MarketsMOJO. This rating was last updated on 08 July 2025, reflecting a significant reassessment of the stock’s outlook. However, all fundamentals, returns, and financial metrics discussed below are current as of 01 June 2026, providing investors with the latest perspective on the company’s position.
Read full news article Announcements
Corporate Actions

No Upcoming Board Meetings

No Dividend history available

No Splits history available

No Bonus history available

No Rights history available
Quality key factors
Valuation key factors
Technicals key factors
 Technical Indicator Scale: Bearish, Mildly Bearish, Sideways, Mildly Bullish, Bullish Turned
 Shareholding Snapshot : Mar 2026
Shareholding Compare (%holding)
Non Institution
None
Held by 0 Schemes
Held by 19 FIIs (1.37%)
Vakrangee Holdings Private Limited (22.74%)
Life Insurance Corporation Of India (6.07%)
50.42%
Quarterly Results Snapshot (Standalone) - Mar'26 - QoQ

QoQ Growth in quarter ended Mar 2026 is -73.44% vs 37.85% in Dec 2025

QoQ Growth in quarter ended Mar 2026 is 16.90% vs -36.54% in Dec 2025
Half Yearly Results Snapshot (Standalone) - Sep'25
Growth in half year ended Sep 2025 is 9.43% vs -52.29% in Sep 2024
Growth in half year ended Sep 2025 is -88.03% vs 126.15% in Sep 2024
Nine Monthly Results Snapshot (Standalone) - Dec'25
YoY Growth in nine months ended Dec 2025 is -37.88% vs 16.81% in Dec 2024
YoY Growth in nine months ended Dec 2025 is -122.88% vs 136.53% in Dec 2024
Annual Results Snapshot (Standalone) - Mar'26
YoY Growth in year ended Mar 2026 is -44.12% vs 39.44% in Mar 2025
YoY Growth in year ended Mar 2026 is 99.96% vs -1,381.22% in Mar 2025
About VL E-Governance & IT Solutions Ltd

Company Coordinates


