
Compare VLS Finance with Similar Stocks
Dashboard
With a Operating Losses, the company has a Weak Long Term Fundamental Strength
- Poor long term growth as Net Sales has grown by an annual rate of -29.23% and Operating profit at -36.07%
- PBT LESS OI(Q) At Rs -105.33 cr has Fallen at -89.82%
- PAT(Q) At Rs -74.54 cr has Fallen at -87.1%
- PBDIT(Q) Lowest at Rs -104.46 cr.
With ROE of 1, it has a Expensive valuation with a 0.4 Price to Book Value
Despite the size of the company, domestic mutual funds hold only 0% of the company
Stock DNA
Non Banking Financial Company (NBFC)
INR 806 Cr (Micro Cap)
37.00
21
0.63%
0.00
1.03%
0.38
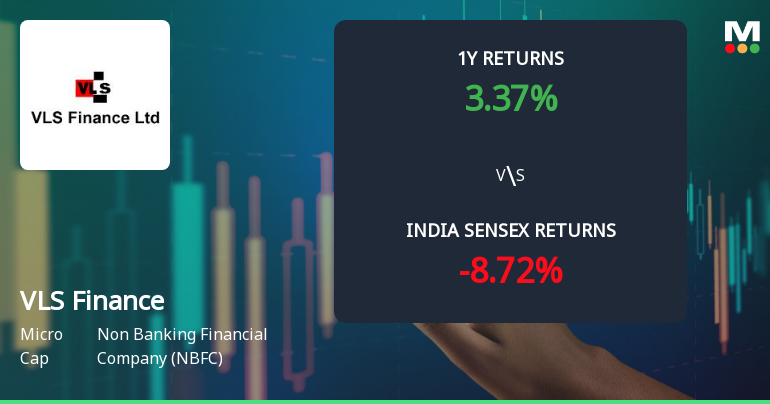
Total Returns (Price + Dividend) 
Latest dividend: 1.5 per share ex-dividend date: Sep-12-2025
Risk Adjusted Returns v/s
Returns Beta

News
VLS Finance Ltd Technical Momentum Shifts Amid Mixed Indicator Signals
VLS Finance Ltd, a micro-cap player in the Non Banking Financial Company (NBFC) sector, has experienced a notable shift in its technical momentum, moving from a mildly bullish stance to a sideways trend. Despite a recent downgrade in its Mojo Grade to Strong Sell, the stock’s mixed technical indicators present a complex picture for investors navigating the current market environment.
Read full news article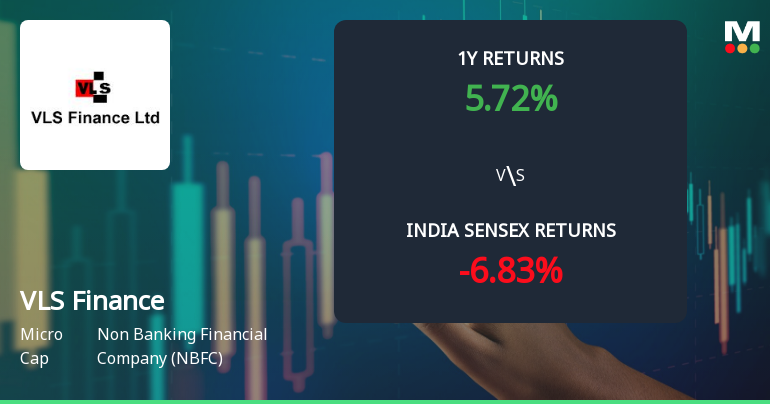
VLS Finance Ltd Technical Momentum Shifts Amid Mixed Market Signals
VLS Finance Ltd has exhibited a notable shift in its technical momentum, moving from a sideways trend to a mildly bullish stance, despite a complex mix of indicator signals. The micro-cap NBFC’s recent price action and technical parameters suggest cautious optimism, though underlying bearish monthly trends and a strong sell Mojo Grade temper enthusiasm.
Read full news article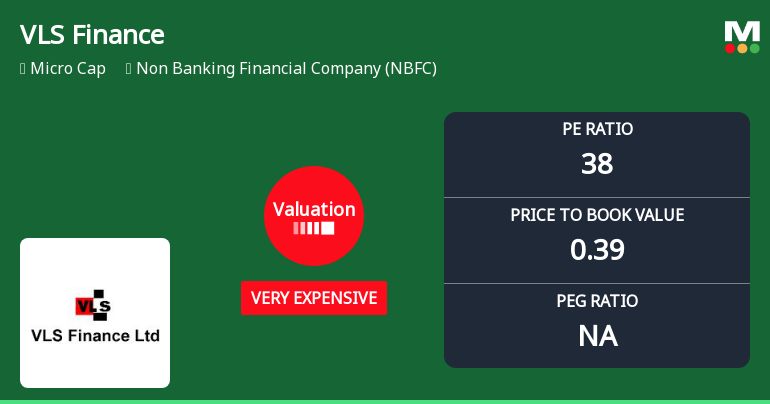
VLS Finance Ltd Valuation Shifts Signal Heightened Price Risk Amid Strong Sell Rating
VLS Finance Ltd, a micro-cap player in the Non Banking Financial Company (NBFC) sector, has seen its valuation parameters shift markedly, with its price-to-earnings (P/E) ratio climbing to 37.9 and price-to-book value (P/BV) remaining at a low 0.39. This repositioning from expensive to very expensive territory raises questions about the stock’s price attractiveness relative to its historical averages and peer group, despite recent positive price momentum.
Read full news article Announcements
VLS Finance Limited - Clarification
27-Nov-2019 | Source : NSEVLS Finance Limited with respect to announcement dated 25-Nov-2019, regarding Change in Director(s) of the company.á On basis of above the Company is required to clarify following: 1.áDate of appointment & term of appointment in case of appointment of Dr. Rajeev Lochan Bishnoi. The response of the Company is awaited.
VLS Finance Limited - Cessation
13-Nov-2019 | Source : NSEVLS Finance Limited has informed the Exchange regarding Cessation of Mr S Ramesh as Independent Director of the company w.e.f. November 08, 2019.
VLS Finance Limited - Trading Window
04-Nov-2019 | Source : NSEVLS Finance Limited has informed the Exchange regarding the Trading Window closure pursuant to SEBI (Prohibition of Insider Trading) Regulations, 2015 which will remain closed from 1-10-2019 till 27-11-2019.
Corporate Actions

No Upcoming Board Meetings

VLS Finance Ltd has declared 15% dividend, ex-date: 12 Sep 25

No Splits history available

No Bonus history available

No Rights history available
Quality key factors
Valuation key factors
Technicals key factors
 Technical Indicator Scale: Bearish, Mildly Bearish, Sideways, Mildly Bullish, Bullish Turned
 Shareholding Snapshot : Mar 2026
Shareholding Compare (%holding)
Promoters
None
Held by 0 Schemes
Held by 34 FIIs (1.32%)
Vls Capital Limited (42.5%)
Prateek Bansal (2.56%)
35.88%
Quarterly Results Snapshot (Consolidated) - Mar'26 - YoY

YoY Growth in quarter ended Mar 2026 is -103.08% vs -149.63% in Mar 2025
YoY Growth in quarter ended Mar 2026 is -87.15% vs -153.78% in Mar 2025
Half Yearly Results Snapshot (Consolidated) - Sep'25

Growth in half year ended Sep 2025 is -47.92% vs 7.02% in Sep 2024
Growth in half year ended Sep 2025 is -45.79% vs -11.03% in Sep 2024
Nine Monthly Results Snapshot (Consolidated) - Dec'25
YoY Growth in nine months ended Dec 2025 is -8.85% vs -50.90% in Dec 2024
YoY Growth in nine months ended Dec 2025 is 11.94% vs -65.63% in Dec 2024
Annual Results Snapshot (Consolidated) - Mar'26
YoY Growth in year ended Mar 2026 is -61.74% vs -74.69% in Mar 2025
YoY Growth in year ended Mar 2026 is -52.92% vs -85.76% in Mar 2025
About VLS Finance Ltd

Company Coordinates


