
Compare VST Industries with Similar Stocks
Dashboard
High Management Efficiency with a high ROE of 26.40%
The company is Net-Debt Free
With a growth in Operating Profit of 129.43%, the company declared Very Positive results in Mar 26
With ROE of 23, it has a Fair valuation with a 3.6 Price to Book Value
Majority shareholders : Non Institution
Total Returns (Price + Dividend) 
Latest dividend: 10 per share ex-dividend date: Jul-03-2025
Risk Adjusted Returns v/s
Returns Beta

News

VST Industries Ltd Upgraded to Strong Buy on Robust Financials and Technical Momentum
VST Industries Ltd has been upgraded from a Buy to a Strong Buy rating, reflecting significant improvements across financial performance, valuation metrics, and technical indicators. The company’s recent quarterly results, combined with a bullish technical outlook, have prompted this positive reassessment by MarketsMOJO, signalling strong investor confidence in the FMCG small-cap stock.
Read full news article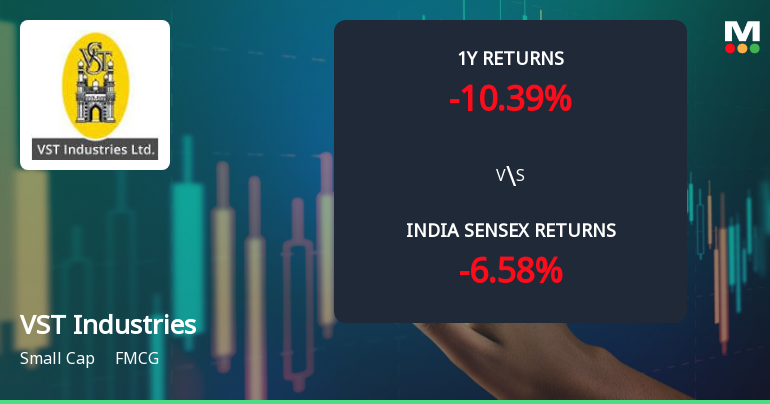
VST Industries Ltd Technical Momentum Shifts Signal Bullish Outlook
VST Industries Ltd has demonstrated a notable shift in price momentum, moving from a mildly bullish to a bullish technical trend, supported by a series of positive signals across key indicators such as MACD, moving averages, and Bollinger Bands. This technical upgrade, coupled with a strong MarketsMOJO score of 84.0 and an upgraded mojo grade to Strong Buy, positions the small-cap FMCG stock as an attractive proposition for investors seeking momentum plays in the sector.
Read full news article
VST Industries Ltd is Rated Buy
VST Industries Ltd is rated 'Buy' by MarketsMOJO, with this rating last updated on 18 June 2026. While the rating was revised on that date, the analysis and financial metrics presented here reflect the stock's current position as of 30 June 2026, providing investors with the most up-to-date view of the company’s performance and outlook.
Read full news article Announcements
Closure of Trading Window
25-Jun-2026 | Source : BSEClosure of Trading Window
Announcement under Regulation 30 (LODR)-Newspaper Publication
23-Jun-2026 | Source : BSEPublication of Notice regarding transfer of unclaimed dividend and equity shares to the Investor Education and Protection Fund
Announcement under Regulation 30 (LODR)-Newspaper Publication
21-May-2026 | Source : BSEPublication of Notice reg. Special Window for Transfer and Dematerialisation of Physical shares
Corporate Actions

No Upcoming Board Meetings

VST Industries Ltd has declared 120% dividend, ex-date: 10 Jul 26

No Splits history available

VST Industries Ltd has announced 10:1 bonus issue, ex-date: 06 Sep 24

No Rights history available
Quality key factors
Valuation key factors
Technicals key factors
 Technical Indicator Scale: Bearish, Mildly Bearish, Sideways, Mildly Bullish, Bullish Turned
 Shareholding Snapshot : Mar 2026
Shareholding Compare (%holding)
Non Institution
None
Held by 5 Schemes (5.04%)
Held by 53 FIIs (1.34%)
The Raleigh Investment Company Limited (23.45%)
Bright Star Investments Pvt. Ltd. (25.95%)
26.23%
Quarterly Results Snapshot (Standalone) - Mar'26 - QoQ

QoQ Growth in quarter ended Mar 2026 is 22.41% vs 11.23% in Dec 2025
QoQ Growth in quarter ended Mar 2026 is 93.74% vs 1.72% in Dec 2025
Half Yearly Results Snapshot (Standalone) - Sep'25

Growth in half year ended Sep 2025 is -7.11% vs -0.24% in Sep 2024
Growth in half year ended Sep 2025 is 14.04% vs -36.65% in Sep 2024
Nine Monthly Results Snapshot (Standalone) - Dec'25
YoY Growth in nine months ended Dec 2025 is -3.99% vs 0.27% in Dec 2024
YoY Growth in nine months ended Dec 2025 is -26.04% vs 11.26% in Dec 2024
Annual Results Snapshot (Standalone) - Mar'26
YoY Growth in year ended Mar 2026 is 4.75% vs -1.60% in Mar 2025
YoY Growth in year ended Mar 2026 is 0.64% vs -3.70% in Mar 2025
About VST Industries Ltd

Company Coordinates


