
Compare VST Industries with Similar Stocks
Dashboard
High Management Efficiency with a high ROE of 26.40%
The company is Net-Debt Free
With a growth in Operating Profit of 129.43%, the company declared Very Positive results in Mar 26
With ROE of 20.2, it has a Fair valuation with a 2.9 Price to Book Value
Majority shareholders : Non Institution
Total Returns (Price + Dividend) 
Latest dividend: 11.973509933774833 per share ex-dividend date: Jul-10-2026
Risk Adjusted Returns v/s
Returns Beta

News
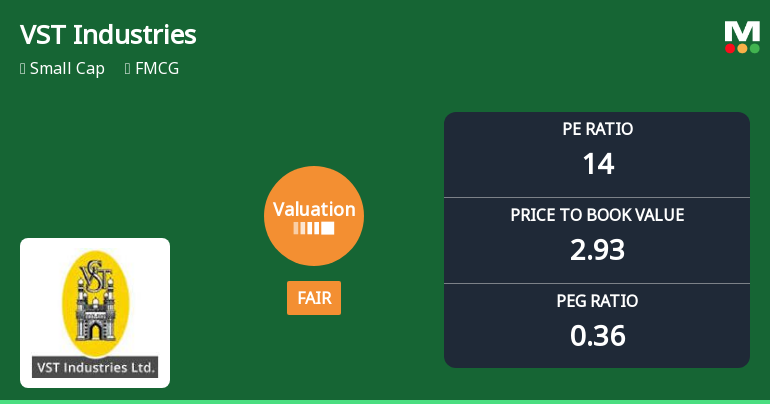
VST Industries Ltd Valuation Shifts to Fair; Price Attractiveness Reassessed Amid Market Volatility
VST Industries Ltd, a prominent player in the FMCG sector, has recently undergone a notable shift in its valuation parameters, moving from an expensive to a fair valuation grade. This recalibration, reflected in key metrics such as the price-to-earnings (P/E) and price-to-book value (P/BV) ratios, signals a changing landscape for investors assessing the stock’s price attractiveness amid broader market dynamics and sectoral trends.
Read full news article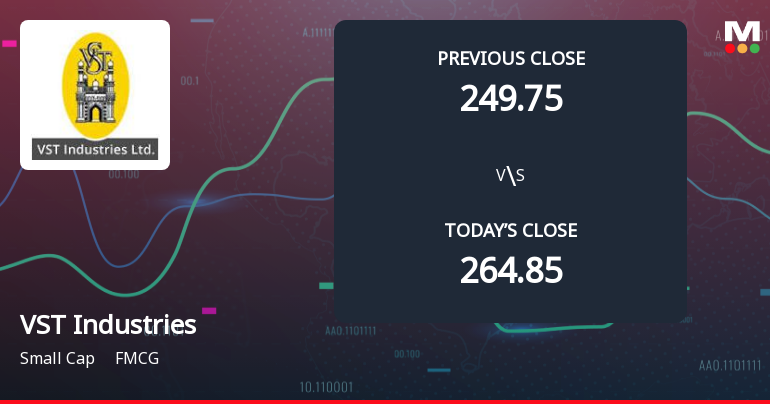

VST Industries Downgraded to Buy Amid Mixed Technical and Valuation Signals
VST Industries Ltd, a prominent player in the FMCG sector specialising in cigarettes and tobacco, has seen its investment rating downgraded from Strong Buy to Buy as of 8 July 2026. This adjustment reflects nuanced changes across four key parameters: quality, valuation, financial trend, and technical indicators. While the company continues to demonstrate solid fundamentals and operational efficiency, evolving market dynamics and technical signals have prompted a more cautious stance among analysts.
Read full news article Announcements
VST Industries Limited - Other General Purpose
03-Dec-2019 | Source : NSEVST Industries Limited has informed the Exchange regarding Submission of half yearly disclosure on Related Party Transactions for the half year ended September 30, 2019.
VST Industries Limited - Updates
06-Nov-2019 | Source : NSEVST Industries Limited has informed the Exchange regarding 'Newspaper publication of Unaudited Financial Results for the quarter and six months ended 30th September, 2019'.
VST Industries Limited - Code of Conduct under SEBI(PIT) Reg., 2015
05-Nov-2019 | Source : NSEVST Industries Limited has informed the Exchange regarding the Code of Conduct under SEBI(PIT) Reg., 2015
Corporate Actions

No Upcoming Board Meetings

VST Industries Ltd has declared 120% dividend, ex-date: 10 Jul 26

No Splits history available

VST Industries Ltd has announced 10:1 bonus issue, ex-date: 06 Sep 24

No Rights history available
Quality key factors
Valuation key factors
Technicals key factors
 Technical Indicator Scale: Bearish, Mildly Bearish, Sideways, Mildly Bullish, Bullish Turned
 Shareholding Snapshot : Jun 2026
Shareholding Compare (%holding)
Non Institution
None
Held by 5 Schemes (4.44%)
Held by 57 FIIs (1.79%)
The Raleigh Investment Company Limited (23.45%)
Bright Star Investments Pvt. Ltd. (25.95%)
26.77%
Quarterly Results Snapshot (Standalone) - Mar'26 - QoQ

QoQ Growth in quarter ended Mar 2026 is 22.41% vs 11.23% in Dec 2025
QoQ Growth in quarter ended Mar 2026 is 93.74% vs 1.72% in Dec 2025
Half Yearly Results Snapshot (Standalone) - Sep'25

Growth in half year ended Sep 2025 is -7.11% vs -0.24% in Sep 2024
Growth in half year ended Sep 2025 is 14.04% vs -36.65% in Sep 2024
Nine Monthly Results Snapshot (Standalone) - Dec'25
YoY Growth in nine months ended Dec 2025 is -3.99% vs 0.27% in Dec 2024
YoY Growth in nine months ended Dec 2025 is -26.04% vs 11.26% in Dec 2024
Annual Results Snapshot (Standalone) - Mar'26
YoY Growth in year ended Mar 2026 is 4.75% vs -1.60% in Mar 2025
YoY Growth in year ended Mar 2026 is 0.64% vs -3.70% in Mar 2025
About VST Industries Ltd

Company Coordinates


