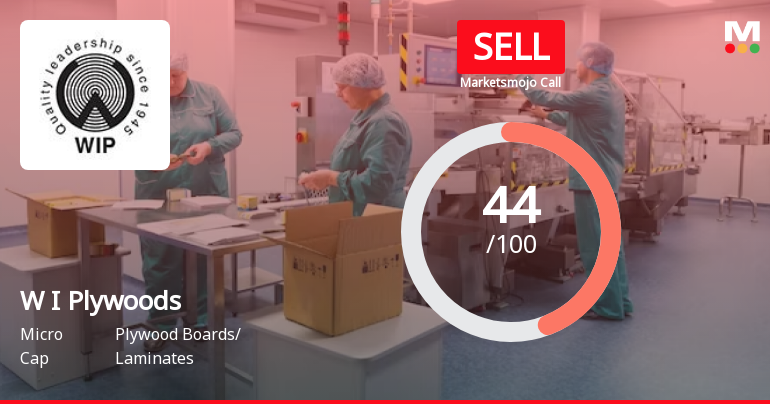
W I Plywoods

  • Market Cap: Micro Cap
  • Industry: Plywood Boards/ Laminates
  • ISIN: INE215F01023
  • NSEID: WIPL
  • BSEID:
INR
166.00
3.01 (1.85%)
BSENSE

Sep 03, 01:06 PM

BSE+NSE Vol: 420

  • Price Points
  • Score
  • Mojo Parameters
  • Total Return
  • News and Corporate Actions
  • Key factors
  • Shareholding
  • Financials
  • CompanyCV
stock-summaryPrice Point
High/Low

1Day

52 Week

Valuation
Technical
Day's Volume

CASH

420.0 (669.23%) Volume

Shareholding (Jun 2026)

FII

0.00%

Held by 0 FIIs

DII

2.66%

Held by 1 DIIs

Promoter

37.88%

Why is Western India Plywoods Ltd falling/rising?

03-Sep-2026

As of 02-Sep, Western India Plywoods Ltd's stock price is rising by 0.58%, but it has underperformed recently with declines of 2.97% over the past week and 3.68% over the past month. Despite a year-to-date increase of 11.91% and rising promoter confidence, the company faces significant long-term growth challenges and an expensive valuation.

As of 02-Sep, Western India Plywoods Ltd's stock price is currently rising, as indicated by a change of 0.94 (0.58%) upward. Despite this positive movement today, the stock has underperformed in the short term, with a decline of 2.97% over the past week and 3.68% over the past month. However, it has shown a year-to-date increase of 11.91%, contrasting with a decline of 8.48% in the Sensex during the same period.<BR><BR>The stock's performance today is supported by rising promoter confidence, as promoters have increased their stake in the company by 0.82% over the previous quarter, now holding 37.88%. This increase in stake is generally interpreted as a sign of confidence in the company's future prospects.<BR><BR>On the downside, the stock faces challenges such as poor long-term growth, with operating profit declining at an annual rate of 10.01% over the last five years. Additionally, the company reported negative results in June, with a significant drop in profit before tax and the lowest return on capital employed recorded at 4.39%. Furthermore, the stock's valuation appears expensive relative to its returns, with a low return on capital employed and a high enterprise value to capital employed ratio.<BR><BR>In summary, while the stock is experiencing a rise in price today, it is important to consider the broader context of its recent performance and underlying financial challenges.

View full answer

Which are the latest news on W I Plywoods?

03-Sep-2026

Who are in the management team of W I Plywoods?

01-Sep-2026

The management team of W I Plywoods includes P K Mayan Mohammed (Managing Director), R Balakrishnan (CFO & Company Secretary), T Balakrishnan (Chairman & Independent Director), Pushya Sitaraman (Independent Director), Parthasarathi Thiruvengadam (Director), Prasanth Ragunathan (Nominee), and Radha Unni (Director).

The management team of W I Plywoods includes the following members:<BR><BR>1. **P K Mayan Mohammed** - Managing Director<BR>2. **R Balakrishnan** - Chief Finance Officer & Company Secretary<BR>3. **T Balakrishnan** - Chairman & Independent Director<BR>4. **Pushya Sitaraman** - Independent Director<BR>5. **Parthasarathi Thiruvengadam** - Director<BR>6. **Prasanth Ragunathan** - Nominee<BR>7. **Radha Unni** - Director<BR><BR>If you need more details about their roles or contributions, feel free to ask!

View full answer

What does W I Plywoods do?

01-Sep-2026

Western India Plywoods Ltd manufactures high-quality plywood and related products, established in 1945. As of June 2026, it reported net sales of 26 Cr and a market cap of INR 142 Cr.

Overview: <BR>Western India Plywoods Ltd is a manufacturer of high-quality plywood and related products, operating in the plywood boards and laminates industry within the micro-cap market segment.<BR><BR>History: <BR>Established in 1945, Western India Plywoods Ltd began its operations with the manufacture of sawn timber and plywood. The latest quarterly results reported net sales and net profit for June 2026.<BR><BR>Financial Snapshot: <BR>- Net Sales: 26 Cr (Quarterly Results - Jun 2026) <BR>- Net Profit: 0 Cr (Quarterly Results - Jun 2026) <BR>- Market Cap: INR 142 Cr (Micro Cap) <BR><BR>Key Metrics: <BR>- P/E: N/A <BR>- Industry P/E: 18 <BR>- Dividend Yield: 0.71% <BR>- Debt-Equity: 0.14 <BR>- Return on Equity: 1.01% <BR>- Price to Book: 3.18 <BR><BR>Contact Details: <BR>Address: Mill Road, Baliapatam Kannur Kerala : 670010 <BR>Tel: 91-0497-2778151 (4 lines) <BR>Fax: 91-0497-2778181 <BR>Email: westernply@gmail.com/mail@wipltd.in <BR>Website: http://www.wipltd.in

View full answer

Who are the peers of the W I Plywoods?

01-Sep-2026

W I Plywoods' peers include Greenply Industries, Greenpanel Industries, Rushil Decor, Archidply Industries, Airo Lam, Sylvan Plyboard, Milton Industries, Ecoboard Industries, and Duroply Industries. W I Plywoods has the highest 1-year return at 5.77%, while Greenpanel Industries has the lowest at -42.10%.

Peers: The peers of W I Plywoods are Greenply Industr, Greenpanel Inds., Rushil Decor, Archidply Inds., Airo Lam, Sylvan Plyboard, Milton Industri., Ecoboard Inds., and Duroply Indust.<BR><BR>Quality Snapshot: Excellent management risk is observed at Greenpanel Inds., while Average management risk is found at Greenply Industr, Rushil Decor, Sylvan Plyboard, Milton Industri., and W I Plywoods. Below Average management risk is noted at Archidply Inds., Airo Lam, Ecoboard Inds., and Duroply Indust. Growth is Excellent at Greenpanel Inds., Below Average at Greenply Industr, W I Plywoods, Rushil Decor, Airo Lam, Sylvan Plyboard, Milton Industri., Ecoboard Inds., and Duroply Indust., and Average at Archidply Inds. Capital Structure is Excellent at Greenpanel Inds., Average at Greenply Industr, W I Plywoods, and Below Average at Rushil Decor, Archidply Inds., Airo Lam, Sylvan Plyboard, Milton Industri., Ecoboard Inds., and Duroply Indust.<BR><BR>Return Snapshot: The peer with the highest 1-year return is W I Plywoods at 5.77%, while the lowest is Greenpanel Inds. at -42.10%. W I Plywoods' return is significantly higher than that of Greenpanel Inds. Additionally, the six-month return is negative for Airo Lam, Ecoboard Inds., and Duroply Indust.

View full answer

How big is W I Plywoods?

01-Sep-2026

As of 31st August, Western India Plywoods Ltd has a market capitalization of 142.00 Cr and reported Net Sales of 116.36 Cr with a Net Profit loss of 0.19 Cr over the latest four quarters. Shareholder's Funds are 45.33 Cr and Total Assets are 79.69 Cr as of March 2025.

As of 31st August, Western India Plywoods Ltd has a market capitalization of 142.00 Cr, categorizing it as a Micro Cap company.<BR><BR>In the latest four quarters, the company reported Net Sales of 116.36 Cr. However, it experienced a loss of 0.19 Cr in Net Profit during the same period.<BR><BR>The latest annual period for the balance sheet is March 2025. Shareholder's Funds are recorded at 45.33 Cr, while Total Assets amount to 79.69 Cr.

View full answer

Should I buy, sell or hold Western India Plywoods Ltd?

25-Aug-2026

Are Western India Plywoods Ltd latest results good or bad?

26-May-2026

Western India Plywoods Ltd's latest results are concerning, showing a 1.93% revenue decline and a net loss of ₹0.91 crores, marking a 218.18% decrease year-on-year. The company's operating margin fell to -1.37%, indicating significant operational challenges and reduced promoter confidence.

The latest results for Western India Plywoods Ltd are concerning. In the fourth quarter of FY26, the company reported a revenue decline of 1.93% year-on-year, totaling ₹28.50 crores. More alarmingly, the company experienced a net loss of ₹0.91 crores, which represents a staggering 218.18% decrease compared to the previous year. This marks a significant operational downturn, as the operating margin fell to -1.37%, the lowest on record.<BR><BR>The decline in profitability is attributed to rising employee costs and a lack of positive operating profit, indicating serious operational challenges. Additionally, promoter holdings decreased by 2.31 percentage points to 37.06%, which may signal reduced confidence in the company's future prospects.<BR><BR>Overall, these results reflect a troubling trend for Western India Plywoods, prompting investors to reassess the company's viability in the current market environment.

View full answer

How has been the historical performance of W I Plywoods?

21-Nov-2025

W I Plywoods has shown steady growth in net sales and total assets from Mar'21 to Mar'25, but profitability metrics have fluctuated, with declines in operating profit and profit after tax. The company faces challenges in maintaining consistent profit levels despite rising expenditures.

Answer:<BR>The historical performance of W I Plywoods shows a fluctuating trend in key financial metrics over the years.<BR><BR>Breakdown:<BR>W I Plywoods has experienced a steady increase in net sales, rising from 85.03 Cr in Mar'21 to 116.02 Cr in Mar'25. Total operating income followed a similar trajectory, reaching 116.02 Cr in Mar'25, up from 99.73 Cr in Mar'22. However, the company's total expenditure has also increased, culminating at 109.47 Cr in Mar'25, which reflects rising raw material costs and other expenses. Operating profit (PBDIT) has shown variability, peaking at 8.11 Cr in Mar'23 before declining to 7.20 Cr in Mar'25. Profit before tax has fluctuated, with the highest at 5.07 Cr in Mar'23, but dropping to 4.15 Cr in Mar'25. Profit after tax has similarly decreased from 3.49 Cr in Mar'23 to 2.80 Cr in Mar'25. The company's total assets have increased to 79.69 Cr in Mar'25, while total liabilities also rose to 79.69 Cr, indicating a balance between growth in assets and liabilities. Cash flow from operating activities has shown a decline, with a net cash outflow of 2.00 Cr in Mar'24, down from a positive inflow in previous years. Overall, W I Plywoods has shown growth in sales and assets, but profitability metrics indicate challenges in maintaining consistent profit levels.

View full answer

Is W I Plywoods overvalued or undervalued?

02-Sep-2025

As of September 1, 2025, W I Plywoods is considered overvalued with a PE Ratio of 50.53 and an EV to EBITDA of 23.20, significantly higher than its peers, despite a strong historical return of 213.88% over three years and a low ROE of 6.18%.

As of 1 September 2025, W I Plywoods has moved from a fair to an expensive valuation grade. The company is currently overvalued based on its financial metrics. Key ratios include a PE Ratio of 50.53, an EV to EBITDA of 23.20, and a Price to Book Value of 3.33, which are significantly higher than those of its peers. For instance, Garware Hi Tech has a PE Ratio of 19.85 and an EV to EBITDA of 13.51, while AGI Greenpac boasts a much lower PE of 16.25 and an EV to EBITDA of 9.38, indicating that W I Plywoods is trading at a premium compared to its competitors.<BR><BR>Despite a strong historical performance with a 3-year return of 213.88%, the current valuation does not seem justified given the company's ROE of 6.18% and a dividend yield of only 0.67%. The recent stock performance has outpaced the Sensex in the short term, but the long-term outlook appears less favorable, reinforcing the conclusion that W I Plywoods is currently overvalued.

View full answer

Who are the top shareholders of the W I Plywoods?

17-Jul-2025

The top shareholders of W I Plywoods include promoter P K Rafia with 3.81% and public shareholder Yogesh Rasiklal Doshi with 4.84%. Individual investors hold a total of 37.15%, with no mutual funds or foreign institutional investors currently involved.

The top shareholders of W I Plywoods include P K Rafia, who is the promoter with the highest holding at 3.81%. The highest public shareholder is Yogesh Rasiklal Doshi, holding 4.84%. Additionally, individual investors collectively hold 37.15% of the company's shares. It's also noteworthy that there are no mutual funds or foreign institutional investors currently holding shares in the company.

View full answer

What is the technical trend for W I Plywoods?

09-Jun-2025

As of April 2, 2025, W I Plywoods is in a bearish trend with moderate strength, indicated by bearish signals from MACD, RSI, Bollinger Bands, moving averages, and KST, suggesting a negative outlook for the stock in the near term.

As of 2 April 2025, the technical trend for W I Plywoods has changed from sideways to bearish. The current stance is bearish with a moderate strength. Key indicators driving this include a bearish MACD on the weekly chart, a bearish RSI on the monthly chart, and bearish signals from both Bollinger Bands and moving averages on the daily timeframe. The KST is also bearish on the weekly and mildly bearish on the monthly, while the OBV indicates a mildly bearish trend. Overall, the combination of these indicators suggests a negative outlook for the stock in the near term.

View full answer

When is the next results date for W I Plywoods?

06-Jun-2025

No Upcoming Board Meetings

Has W I Plywoods declared dividend?

06-Jun-2025

Yes, Western India Plywoods Ltd has declared a 12% dividend, amounting to ₹1.2 per share, with an ex-date of September 17, 2024. Despite recent price declines, the company has shown significant total returns over longer periods.

Western India Plywoods Ltd has declared a 12% dividend.<BR><BR>Dividend Details:<BR>- Percentage announced: 12%<BR>- Amount per share: 1.2<BR>- Ex-date: 17 Sep 24<BR><BR>Dividend Yield: 0.79%.<BR><BR>Total Returns by Period:<BR>In the last 6 months, the price return was -30.04%, the dividend return was 0%, resulting in a total return of -30.04%.<BR><BR>Over the past year, the price return was -6.45%, with a dividend return of 0.73%, leading to a total return of -5.72%.<BR><BR>In the 2-year period, the price return was 54.6%, the dividend return was 2.09%, culminating in a total return of 56.69%.<BR><BR>For the 3-year period, the price return was 188.77%, with a dividend return of 5.77%, resulting in a total return of 194.54%.<BR><BR>In the last 4 years, the price return was 128.26%, the dividend return was 5.53%, leading to a total return of 133.79%.<BR><BR>Over the past 5 years, the price return was 194.33%, with a dividend return of 7.60%, resulting in a total return of 201.93%.<BR><BR>Overall, Western India Plywoods Ltd has declared a dividend and has shown varying returns over different periods, with significant total returns in the longer term despite recent declines in price returns.

View full answer
iScoreScore
Click here to find our call on this stock
Strong Sell
Sell
Hold
Buy
Strong Buy

Dashboard

1

Poor long term growth as Operating profit has grown by an annual rate -10.01% of over the last 5 years

 
2

Negative results in Jun 26

3

With ROCE of 3, it has a Expensive valuation with a 2.8 Enterprise value to Capital Employed

4

Below par performance in long term as well as near term

stock-summaryMojo Parameters

Mojo Parameters

Loading Valuation Snapshot...

Stock DNA

stock-summary
Industry

Plywood Boards/ Laminates

stock-summary
Market cap

INR 141 Cr (Micro Cap)

stock-summary
P/E

NA (Loss Making)

stock-summary
Industry P/E

18

stock-summary
Dividend Yield

0.74%

stock-summary
Debt Equity

0.14

stock-summary
Return on Equity

1.01%

stock-summary
Price to Book

3.09

Revenue and Profits:
Net Sales:
26 Cr
(Quarterly Results - Jun 2026)
Net Profit:
0 Cr
stock-summaryTotal Returns
Total Returns (Price + Dividend) stock-summary
Dividend Yield (0.74%)
TimePeriod
Price Return
Dividend Return
Total Return
3 Months
8.85%
0%
8.85%
6 Months
10.67%
0%
10.67%
1 Year
-2.42%
0.71%
-1.71%
2 Years
-19.02%
1.19%
-17.83%
3 Years
19.38%
2.63%
22.01%
4 Years
193.81%
3.98%
197.79%
5 Years
161.42%
6.99%
168.41%

Latest dividend: 1.2 per share ex-dividend date: Sep-18-2025

Risk Adjusted Returns v/s stock-summary
Returns Beta
Icon
Beta has not been calculated since enough price history is not available
stock-summaryNews & Corporate Actions

Announcements stock-summary

The Western India Plywoods Limited - Outcome of Board Meeting

14-Nov-2019 | Source : NSE

The Western India Plywoods Limited has informed the Exchange regarding Board meeting held on November 13, 2019.

Shareholders meeting

20-Sep-2019 | Source : NSE

The Western India Plywoods Limited has informed the Exchange regarding Proceedings of Annual General Meeting held on September 20, 2019. Further, the company has informed the Exchange regarding voting results along with copy of scrutinizers report together with copy of minutes.

AGM\/Book Closure

21-Aug-2019 | Source : NSE

The Western India Plywoods Limited has informed the Exchange that the Register of Members & Share Transfer Books of the Company will remain closed from September 14, 2019 to September 20, 2019(both days inclusive) for the purpose of Annual General Meeting of the Company to be held on September 20, 2019 and Payment of Dividend

Corporate Actions stock-summary

stock-summary
BOARD MEETING

No Upcoming Board Meetings

stock-summary
DIVIDEND

Western India Plywoods Ltd has declared 12% dividend, ex-date: 18 Sep 25

stock-summary
SPLITS

No Splits history available

stock-summary
BONUS

No Bonus history available

stock-summary
RIGHTS

No Rights history available

stock-summaryKey Factors

Quality key factors stock-summary

Factor
Value
Sales Growth (5y)
4.49%
EBIT Growth (5y)
-10.01%
EBIT to Interest (avg)
3.19
Debt to EBITDA (avg)
3.04
Net Debt to Equity (avg)
0.14
Sales to Capital Employed (avg)
1.86
Tax Ratio
100.00%
Dividend Payout Ratio
36.38%
Pledged Shares
0
Institutional Holding
2.67%
ROCE (avg)
7.78%
ROE (avg)
4.90%

Valuation key factors

Factor
Value
P/E Ratio
NA (Loss Making)
Industry P/E
Price to Book Value
3.09
EV to EBIT
144.63
EV to EBITDA
61.54
EV to Capital Employed
2.83
EV to Sales
1.24
PEG Ratio
NA
Dividend Yield
0.74%
ROCE (Latest)
2.98%
ROE (Latest)
1.01%

Technicals key factors

Indicator
Weekly
Monthly
MACD
Mildly Bearish
Bullish
RSI
No Signal
No Signal
Bollinger Bands
Sideways
Sideways
Moving Averages
Mildly Bullish (Daily)
KST
Bullish
Bearish
Dow Theory
Mildly Bullish
No Trend
OBV
No Trend
No Trend
stock-summary Technical Indicator Scale: Bearish, Mildly Bearish, Sideways, Mildly Bullish, Bullish  Turned 
stock-summaryShareholding
Shareholding Snapshot : Jun 2026stock-summary
Shareholding Compare (%holding) stock-summary
Majority shareholders

Non Institution

Pledged Promoter Holdings

None

Mutual Funds

Held by 0 Schemes

FIIs

Held by 0 FIIs

Promoter with highest holding

Puthiya Kottal Jameela (5.39%)

Highest Public shareholder

Yogesh Rasiklal Doshi (0%)

Individual Investors Holdings

40.39%

stock-summaryFinancial
[
  {
    "link": "quarterly",
    "btn_text": "All Quarterly Results",
    "header": "Quarterly Results Snapshot (Consolidated) - Jun'26 - YoY",
    "rhs": [
      {
        "prefix": "Net Sales ",
        "suffix": "YoY Growth in quarter ended Jun 2026 is -8.69% vs 16.09% in Jun 2025",
        "dir": -1
      },
      {
        "prefix": "Consolidated Net Profit ",
        "suffix": "YoY Growth in quarter ended Jun 2026 is -188.24% vs 126.67% in Jun 2025",
        "dir": -1
      }
    ],
    "table": {
      "header": [
        "Jun'26",
        "Jun'25",
        "Change(%)"
      ],
      "body": [
        {
          "field": "Net Sales",
          "val1": "26.49",
          "val2": "29.01",
          "chgp": "-8.69%",
          "chgp_class": "negative"
        },
        {
          "field": "Operating Profit (PBDIT) excl Other Income",
          "val1": "-0.06",
          "val2": "1.16",
          "chgp": "-105.17%",
          "chgp_class": "negative"
        },
        {
          "field": "Interest",
          "val1": "0.15",
          "val2": "0.21",
          "chgp": "-28.57%",
          "chgp_class": "positive"
        },
        {
          "field": "Exceptional Items",
          "val1": "0.00",
          "val2": "0.00",
          "chgp": "",
          "chgp_class": "neutral"
        },
        {
          "field": "Consolidate Net Profit",
          "val1": "-0.30",
          "val2": "0.34",
          "chgp": "-188.24%",
          "chgp_class": "negative"
        },
        {
          "field": "Operating Profit Margin (Excl OI)",
          "val1": "-0.23%",
          "val2": "4.00%",
          "chgp": "-4.23%",
          "chgp_class": "negative"
        }
      ]
    }
  },
  {
    "link": "half-yearly",
    "btn_text": "All Half Yearly Results",
    "header": "Half Yearly Results Snapshot (Consolidated) - Sep'25",
    "rhs": [
      {
        "prefix": "Net Sales ",
        "suffix": " Growth in half year ended Sep 2025 is 5.08% vs 7.95% in Sep 2024",
        "dir": -1
      },
      {
        "prefix": "Consolidated Net Profit ",
        "suffix": " Growth in half year ended Sep 2025 is -53.91% vs -25.81% in Sep 2024",
        "dir": -1
      }
    ],
    "table": {
      "header": [
        "Sep'25",
        "Sep'24",
        "Change(%)"
      ],
      "body": [
        {
          "field": "Net Sales",
          "val1": "58.93",
          "val2": "56.08",
          "chgp": "5.08%",
          "chgp_class": "positive"
        },
        {
          "field": "Operating Profit (PBDIT) excl Other Income",
          "val1": "1.98",
          "val2": "2.75",
          "chgp": "-28.00%",
          "chgp_class": "negative"
        },
        {
          "field": "Interest",
          "val1": "0.39",
          "val2": "0.45",
          "chgp": "-13.33%",
          "chgp_class": "positive"
        },
        {
          "field": "Exceptional Items",
          "val1": "0.00",
          "val2": "0.00",
          "chgp": "",
          "chgp_class": "neutral"
        },
        {
          "field": "Consolidate Net Profit",
          "val1": "0.53",
          "val2": "1.15",
          "chgp": "-53.91%",
          "chgp_class": "negative"
        },
        {
          "field": "Operating Profit Margin (Excl OI)",
          "val1": "3.36%",
          "val2": "4.90%",
          "chgp": "-1.54%",
          "chgp_class": "negative"
        }
      ]
    }
  },
  {
    "link": "nine-monthly",
    "btn_text": "All Nine Monthly Results",
    "header": "Nine Monthly Results Snapshot (Consolidated) - Dec'25",
    "rhs": [
      {
        "prefix": "Net Sales ",
        "suffix": "YoY Growth in nine months ended Dec 2025 is 3.93% vs 3.85% in Dec 2024",
        "dir": 1
      },
      {
        "prefix": "Consolidated Net Profit ",
        "suffix": "YoY Growth in nine months ended Dec 2025 is -33.00% vs -41.50% in Dec 2024",
        "dir": 1
      }
    ],
    "table": {
      "header": [
        "Dec'25",
        "Dec'24",
        "Change(%)"
      ],
      "body": [
        {
          "field": "Net Sales",
          "val1": "90.38",
          "val2": "86.96",
          "chgp": "3.93%",
          "chgp_class": "positive"
        },
        {
          "field": "Operating Profit (PBDIT) excl Other Income",
          "val1": "3.96",
          "val2": "4.58",
          "chgp": "-13.54%",
          "chgp_class": "negative"
        },
        {
          "field": "Interest",
          "val1": "0.60",
          "val2": "0.75",
          "chgp": "-20.00%",
          "chgp_class": "positive"
        },
        {
          "field": "Exceptional Items",
          "val1": "0.00",
          "val2": "0.00",
          "chgp": "",
          "chgp_class": "neutral"
        },
        {
          "field": "Consolidate Net Profit",
          "val1": "1.36",
          "val2": "2.03",
          "chgp": "-33.00%",
          "chgp_class": "negative"
        },
        {
          "field": "Operating Profit Margin (Excl OI)",
          "val1": "4.38%",
          "val2": "5.27%",
          "chgp": "-0.89%",
          "chgp_class": "negative"
        }
      ]
    }
  },
  {
    "link": "annual",
    "btn_text": "All Annual Results",
    "header": "Annual Results Snapshot (Consolidated) - Mar'26",
    "rhs": [
      {
        "prefix": "Net Sales ",
        "suffix": "YoY Growth in year ended Mar 2026 is 2.47% vs 6.40% in Mar 2025",
        "dir": -1
      },
      {
        "prefix": "Consolidated Net Profit ",
        "suffix": "YoY Growth in year ended Mar 2026 is -83.93% vs -17.16% in Mar 2025",
        "dir": -1
      }
    ],
    "table": {
      "header": [
        "Mar'26",
        "Mar'25",
        "Change(%)"
      ],
      "body": [
        {
          "field": "Net Sales",
          "val1": "118.88",
          "val2": "116.02",
          "chgp": "2.47%",
          "chgp_class": "positive"
        },
        {
          "field": "Operating Profit (PBDIT) excl Other Income",
          "val1": "3.56",
          "val2": "6.55",
          "chgp": "-45.65%",
          "chgp_class": "negative"
        },
        {
          "field": "Interest",
          "val1": "0.91",
          "val2": "1.17",
          "chgp": "-22.22%",
          "chgp_class": "positive"
        },
        {
          "field": "Exceptional Items",
          "val1": "0.00",
          "val2": "0.00",
          "chgp": "",
          "chgp_class": "neutral"
        },
        {
          "field": "Consolidate Net Profit",
          "val1": "0.45",
          "val2": "2.80",
          "chgp": "-83.93%",
          "chgp_class": "negative"
        },
        {
          "field": "Operating Profit Margin (Excl OI)",
          "val1": "2.99%",
          "val2": "5.65%",
          "chgp": "-2.66%",
          "chgp_class": "negative"
        }
      ]
    }
  }
]

Quarterly Results Snapshot (Consolidated) - Jun'26 - YoYstock-summary

Jun'26
Jun'25
Change(%)
Net Sales
26.49
29.01
-8.69%
Operating Profit (PBDIT) excl Other Income
-0.06
1.16
-105.17%
Interest
0.15
0.21
-28.57%
Exceptional Items
0.00
0.00
Consolidate Net Profit
-0.30
0.34
-188.24%
Operating Profit Margin (Excl OI)
-0.23%
4.00%
-4.23%
Values in Rs Cr.
Direction Arrows
Net Sales

YoY Growth in quarter ended Jun 2026 is -8.69% vs 16.09% in Jun 2025

Direction Arrows
Consolidated Net Profit

YoY Growth in quarter ended Jun 2026 is -188.24% vs 126.67% in Jun 2025

Half Yearly Results Snapshot (Consolidated) - Sep'25stock-summary

Sep'25
Sep'24
Change(%)
Net Sales
58.93
56.08
5.08%
Operating Profit (PBDIT) excl Other Income
1.98
2.75
-28.00%
Interest
0.39
0.45
-13.33%
Exceptional Items
0.00
0.00
Consolidate Net Profit
0.53
1.15
-53.91%
Operating Profit Margin (Excl OI)
3.36%
4.90%
-1.54%
Values in Rs Cr.
Direction Arrows
Net Sales

Growth in half year ended Sep 2025 is 5.08% vs 7.95% in Sep 2024

Direction Arrows
Consolidated Net Profit

Growth in half year ended Sep 2025 is -53.91% vs -25.81% in Sep 2024

Nine Monthly Results Snapshot (Consolidated) - Dec'25stock-summary

Dec'25
Dec'24
Change(%)
Net Sales
90.38
86.96
3.93%
Operating Profit (PBDIT) excl Other Income
3.96
4.58
-13.54%
Interest
0.60
0.75
-20.00%
Exceptional Items
0.00
0.00
Consolidate Net Profit
1.36
2.03
-33.00%
Operating Profit Margin (Excl OI)
4.38%
5.27%
-0.89%
Values in Rs Cr.
Direction Arrows
Net Sales

YoY Growth in nine months ended Dec 2025 is 3.93% vs 3.85% in Dec 2024

Direction Arrows
Consolidated Net Profit

YoY Growth in nine months ended Dec 2025 is -33.00% vs -41.50% in Dec 2024

Annual Results Snapshot (Consolidated) - Mar'26stock-summary

Mar'26
Mar'25
Change(%)
Net Sales
118.88
116.02
2.47%
Operating Profit (PBDIT) excl Other Income
3.56
6.55
-45.65%
Interest
0.91
1.17
-22.22%
Exceptional Items
0.00
0.00
Consolidate Net Profit
0.45
2.80
-83.93%
Operating Profit Margin (Excl OI)
2.99%
5.65%
-2.66%
Values in Rs Cr.
Direction Arrows
Net Sales

YoY Growth in year ended Mar 2026 is 2.47% vs 6.40% in Mar 2025

Direction Arrows
Consolidated Net Profit

YoY Growth in year ended Mar 2026 is -83.93% vs -17.16% in Mar 2025

stock-summaryCompany CV
About Western India Plywoods Ltd stock-summary
stock-summary
Western India Plywoods Ltd
Micro Cap
Plywood Boards/ Laminates
The Kerala based Western India Plywoods Limited., established in 1945, started manufacture of sawn timber and plywood on a modest scale with a few indigenous and lent-leased machinery. The Company is a manufacturer of high quality plywood, Hardboard, Pre-Compressed Boards, Densified Wood, Furniture and Low Density Fibre Boards at Kannur, Kerala.
Company Coordinates stock-summary
Company Details
Mill Road, Baliapatam Kannur Kerala : 670010
stock-summary
Tel: 91-0497-2778151 (4 lines)
stock-summary
westernply@gmail.com/mail@wipltd.in
Registrar Details
Cameo Corporate Services Ltd , Subramanian Buildings No 1 , Club House Road, Chennai