
Compare W S Inds. with Similar Stocks
Dashboard
Low ability to service debt as the company has a high Debt to EBITDA ratio of 7.55 times
- Low ability to service debt as the company has a high Debt to EBITDA ratio of 7.55 times
- The company has been able to generate a Return on Capital Employed (avg) of 5.80% signifying low profitability per unit of total capital (equity and debt)
With ROE of 0.6, it has a Very Expensive valuation with a 1.2 Price to Book Value
Below par performance in long term as well as near term
Total Returns (Price + Dividend) 
Latest dividend: 1.0000 per share ex-dividend date: Sep-03-2009
Risk Adjusted Returns v/s
Returns Beta

News
W S Industries (India) Ltd is Rated Sell
W S Industries (India) Ltd is rated 'Sell' by MarketsMOJO, with this rating last updated on 15 May 2026. However, the analysis and financial metrics discussed here reflect the stock's current position as of 24 July 2026, providing investors with an up-to-date view of its fundamentals, valuation, financial trends, and technical outlook.
Read full news article
W S Industries (India) Ltd is Rated Sell
W S Industries (India) Ltd is rated 'Sell' by MarketsMOJO, with this rating last updated on 15 May 2026. However, the analysis and financial metrics presented here reflect the company’s current position as of 13 July 2026, providing investors with the most recent and relevant data to assess the stock’s outlook.
Read full news article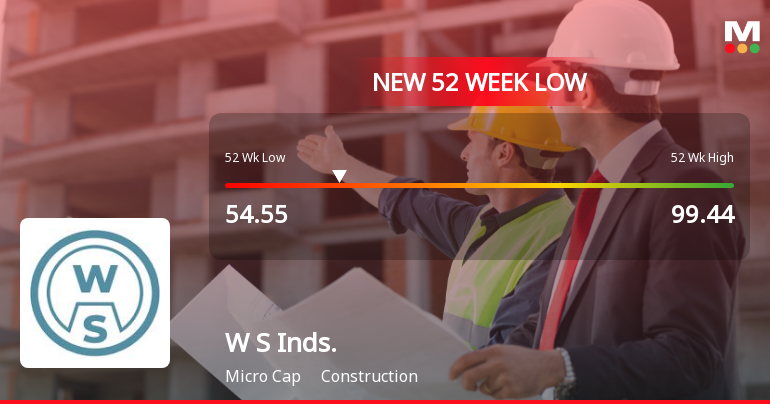
Markets Rally, But W S Industries (India) Ltd Sinks to 52-Week Low in Stock-Specific Sell-Off
Despite a broadly positive market environment, W S Industries (India) Ltd has plunged to a fresh 52-week low of Rs 54.55 on 6 Jul 2026, marking a sharp divergence from the Sensex’s steady gains. The stock’s three-day losing streak has culminated in a 4.33% decline over this period, underperforming its sector by 4.72% today alone.
Read full news article Announcements
Announcement Under Regulation 30
27-Jul-2026 | Source : BSEOutcome of Board Meeting held on 27.07.2026
Compliances-Certificate under Reg. 74 (5) of SEBI (DP) Regulations 2018
02-Jul-2026 | Source : BSECompliance certificate for the quarter ended 30th June 2026
Closure of Trading Window
23-Jun-2026 | Source : BSEClosure of Trading Window for quarter ending 30.06.2026
Corporate Actions

No Upcoming Board Meetings

W S Industries (India) Ltd has declared 10% dividend, ex-date: 03 Sep 09

No Splits history available

No Bonus history available

No Rights history available
Quality key factors
Valuation key factors
Technicals key factors
 Technical Indicator Scale: Bearish, Mildly Bearish, Sideways, Mildly Bullish, Bullish Turned
 Shareholding Snapshot : Jun 2026
Shareholding Compare (%holding)
Promoters
2.1495
Held by 2 Schemes (0.0%)
Held by 6 FIIs (13.53%)
Seyyadurai Nagarajan (11.74%)
Vikasa India Eif I Fund (6.59%)
27.04%
Quarterly Results Snapshot (Consolidated) - Mar'26 - QoQ

QoQ Growth in quarter ended Mar 2026 is 1.26% vs -14.47% in Dec 2025
QoQ Growth in quarter ended Mar 2026 is 239.27% vs -565.85% in Dec 2025
Half Yearly Results Snapshot (Consolidated) - Sep'25

Growth in half year ended Sep 2025 is -62.55% vs 5.45% in Sep 2024
Growth in half year ended Sep 2025 is -75.56% vs -53.84% in Sep 2024
Nine Monthly Results Snapshot (Consolidated) - Dec'25
YoY Growth in nine months ended Dec 2025 is -64.55% vs -15.97% in Dec 2024
YoY Growth in nine months ended Dec 2025 is 99.63% vs -153.02% in Dec 2024
Annual Results Snapshot (Consolidated) - Mar'26
YoY Growth in year ended Mar 2026 is -61.72% vs -26.76% in Mar 2025
YoY Growth in year ended Mar 2026 is 114.79% vs -137.45% in Mar 2025
About W S Industries (India) Ltd

Company Coordinates


