
Compare W S Inds. with Similar Stocks
Dashboard
Low ability to service debt as the company has a high Debt to EBITDA ratio of 7.55 times
- Low ability to service debt as the company has a high Debt to EBITDA ratio of 7.55 times
- The company has been able to generate a Return on Capital Employed (avg) of 5.80% signifying low profitability per unit of total capital (equity and debt)
With ROE of 0.6, it has a Very Expensive valuation with a 1.3 Price to Book Value
Despite the size of the company, domestic mutual funds hold only 0% of the company
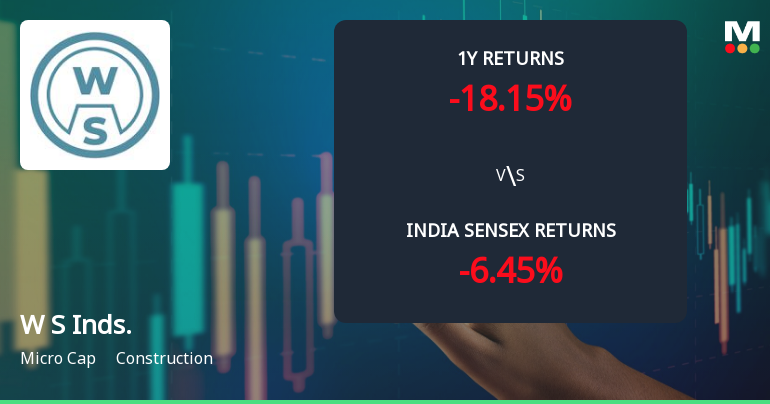
Below par performance in long term as well as near term
Total Returns (Price + Dividend) 
Latest dividend: 1.0000 per share ex-dividend date: Sep-03-2009
Risk Adjusted Returns v/s
Returns Beta

News
W S Industries (India) Ltd Technical Momentum Shifts Amid Bearish Trends
W S Industries (India) Ltd, a micro-cap player in the construction sector, has experienced a notable shift in its technical momentum, moving from a mildly bearish stance to a more pronounced bearish trend. Despite a modest daily price gain of 2.61%, the company’s technical indicators reveal a complex picture of mixed signals, with several monthly metrics deteriorating and weekly signals showing mild bullishness. This article analyses the recent technical parameter changes, price momentum, and the implications for investors amid a challenging market backdrop.
Read full news article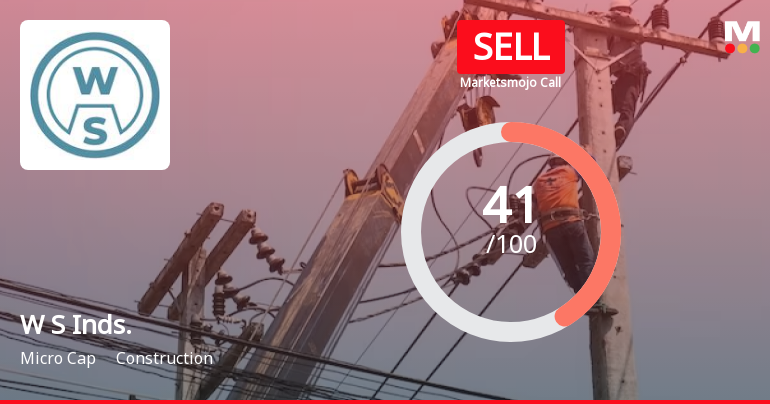
W S Industries (India) Ltd is Rated Sell
W S Industries (India) Ltd is rated Sell by MarketsMOJO. This rating was last updated on 15 May 2026. However, the analysis and financial metrics presented here reflect the stock’s current position as of 21 June 2026, providing investors with the latest insights into the company’s performance and outlook.
Read full news article
W S Industries (India) Ltd Technical Momentum Shifts Amid Mixed Market Signals
W S Industries (India) Ltd, a micro-cap player in the construction sector, has exhibited a nuanced shift in its technical momentum, moving from a bearish stance to a mildly bearish trend. Despite a modest day gain of 0.18%, the stock’s technical indicators present a complex picture, with some weekly signals showing mild bullishness while monthly trends remain bearish. This article analyses the recent technical parameter changes, key momentum indicators, and the stock’s performance relative to the broader market.
Read full news article Announcements
Announcement under Regulation 30 (LODR)-Newspaper Publication
19-Jun-2026 | Source : BSE3rd newspaper publication informing about the special window for transfer and dematerialization of physical shares.
Announcement Under Regulation 30
03-Jun-2026 | Source : BSEUpdate under Regulation 30(7) of SEBI (LODR) Regulations
Announcement Under Regulation 30
26-May-2026 | Source : BSEOutcome of Board Meeting held on 26.05.2026.
Corporate Actions

No Upcoming Board Meetings

W S Industries (India) Ltd has declared 10% dividend, ex-date: 03 Sep 09

No Splits history available

No Bonus history available

No Rights history available
Quality key factors
Valuation key factors
Technicals key factors
 Technical Indicator Scale: Bearish, Mildly Bearish, Sideways, Mildly Bullish, Bullish Turned
 Shareholding Snapshot : Mar 2026
Shareholding Compare (%holding)
Promoters
2.1506
Held by 2 Schemes (0.0%)
Held by 4 FIIs (13.69%)
Seyyadurai Nagarajan (11.74%)
Vikasa India Eif I Fund (6.59%)
26.51%
Quarterly Results Snapshot (Consolidated) - Mar'26 - QoQ

QoQ Growth in quarter ended Mar 2026 is 1.26% vs -14.47% in Dec 2025
QoQ Growth in quarter ended Mar 2026 is 239.27% vs -565.85% in Dec 2025
Half Yearly Results Snapshot (Consolidated) - Sep'25

Growth in half year ended Sep 2025 is -62.55% vs 5.45% in Sep 2024
Growth in half year ended Sep 2025 is -75.56% vs -53.84% in Sep 2024
Nine Monthly Results Snapshot (Consolidated) - Dec'25
YoY Growth in nine months ended Dec 2025 is -64.55% vs -15.97% in Dec 2024
YoY Growth in nine months ended Dec 2025 is 99.63% vs -153.02% in Dec 2024
Annual Results Snapshot (Consolidated) - Mar'26
YoY Growth in year ended Mar 2026 is -61.72% vs -26.76% in Mar 2025
YoY Growth in year ended Mar 2026 is 114.79% vs -137.45% in Mar 2025
About W S Industries (India) Ltd

Company Coordinates


