
Compare Weizmann with Similar Stocks
Stock DNA
Garments & Apparels
INR 134 Cr (Micro Cap)
22.00
15
0.65%
0.06
8.97%
2.01
Total Returns (Price + Dividend) 
Latest dividend: 0.5 per share ex-dividend date: Sep-18-2025
Risk Adjusted Returns v/s
Returns Beta

News

Weizmann Ltd is Rated Sell
Weizmann Ltd is rated Sell by MarketsMOJO, with this rating last updated on 29 July 2025. However, the analysis and financial metrics discussed here reflect the stock’s current position as of 27 June 2026, providing investors with an up-to-date view of the company’s fundamentals, returns, and market performance.
Read full news article
Weizmann Ltd is Rated Sell
Weizmann Ltd is rated 'Sell' by MarketsMOJO, with this rating last updated on 29 July 2025. However, the analysis and financial metrics discussed below reflect the stock's current position as of 16 June 2026, providing investors with an up-to-date view of the company’s performance and outlook.
Read full news article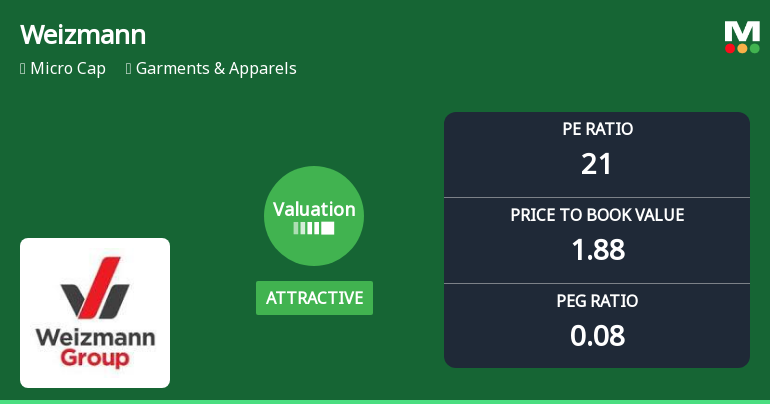
Weizmann Ltd Valuation Shifts Signal Renewed Price Attractiveness Amid Sector Challenges
Weizmann Ltd, a micro-cap player in the Garments & Apparels sector, has seen its valuation parameters shift favourably, moving from a fair to an attractive rating. Despite a challenging return profile relative to the Sensex and peers, the company’s price-to-earnings (P/E) and price-to-book value (P/BV) ratios now present a compelling case for investors seeking value in this segment.
Read full news article Announcements
Disclosures under Reg. 29(1) of SEBI (SAST) Regulations 2011
11-Jun-2026 | Source : BSEThe Exchange has received the disclosure under Regulation 29(1) of SEBI (Substantial Acquisition of Shares & Takeovers) Regulations 2011 for Mira Ankit Khambhati
Disclosures under Reg. 29(2) of SEBI (SAST) Regulations 2011
11-Jun-2026 | Source : BSEThe Exchange has received the disclosure under Regulation 29(2) of SEBI (Substantial Acquisition of Shares & Takeovers) Regulations 2011 for Mira Ankit Khambhati
Disclosures under Reg. 29(2) of SEBI (SAST) Regulations 2011
11-Jun-2026 | Source : BSEThe Exchange has received the disclosure under Regulation 29(2) of SEBI (Substantial Acquisition of Shares & Takeovers) Regulations 2011 for Kanan Siraj
Corporate Actions

No Upcoming Board Meetings

Weizmann Ltd has declared 5% dividend, ex-date: 18 Sep 25

No Splits history available

No Bonus history available

No Rights history available
Quality key factors
Valuation key factors
Technicals key factors
 Technical Indicator Scale: Bearish, Mildly Bearish, Sideways, Mildly Bullish, Bullish Turned
 Shareholding Snapshot : Mar 2026
Shareholding Compare (%holding)
Promoters
None
Held by 0 Schemes
Held by 0 FIIs
Hansneel Impex Private Limited (19.97%)
Kanan Neelkamal Siraj (6.36%)
15.06%
Quarterly Results Snapshot (Consolidated) - Mar'26 - QoQ

QoQ Growth in quarter ended Mar 2026 is 13.70% vs -20.68% in Dec 2025

QoQ Growth in quarter ended Mar 2026 is -84.81% vs 19.10% in Dec 2025
Half Yearly Results Snapshot (Consolidated) - Sep'25
Growth in half year ended Sep 2025 is 25.66% vs -17.89% in Sep 2024
Growth in half year ended Sep 2025 is 2.90% vs -34.04% in Sep 2024
Nine Monthly Results Snapshot (Consolidated) - Dec'25
YoY Growth in nine months ended Dec 2025 is 16.46% vs -12.20% in Dec 2024
YoY Growth in nine months ended Dec 2025 is 9.23% vs -28.81% in Dec 2024
Annual Results Snapshot (Consolidated) - Mar'26
YoY Growth in year ended Mar 2026 is 8.05% vs -4.60% in Mar 2025
YoY Growth in year ended Mar 2026 is 264.17% vs -140.18% in Mar 2025
About Weizmann Ltd

Company Coordinates


