
Compare Welspun Enterp with Similar Stocks
Dashboard
High Management Efficiency with a high ROCE of 16.28%
Healthy long term growth as Operating profit has grown by an annual rate 35.02%
The company has declared positive results in Mar'2026 after 2 consecutive negative quarters
With ROE of 12.7, it has a Fair valuation with a 2.7 Price to Book Value
Majority shareholders : Promoters
Market Beating performance in long term as well as near term
Stock DNA
Construction
INR 8,148 Cr (Small Cap)
21.00
37
0.51%
0.09
12.69%
2.69
Total Returns (Price + Dividend) 
Latest dividend: 3.0169858451290588 per share ex-dividend date: Jul-03-2026
Risk Adjusted Returns v/s
Returns Beta

News

Welspun Enterprises Ltd is Rated Hold
Welspun Enterprises Ltd is rated 'Hold' by MarketsMOJO, with this rating last updated on 15 June 2026. However, the analysis and financial metrics discussed here reflect the company’s current position as of 30 July 2026, providing investors with the most recent insights into its performance and outlook.
Read full news article
Welspun Enterprises Ltd is Rated Hold
Welspun Enterprises Ltd is rated 'Hold' by MarketsMOJO, with this rating last updated on 15 June 2026. However, the analysis and financial metrics presented here reflect the stock's current position as of 19 July 2026, providing investors with an up-to-date view of the company’s performance and outlook.
Read full news article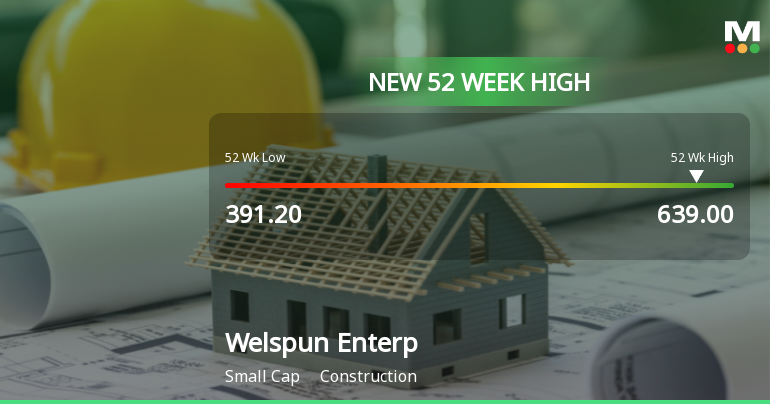
Broad-Based Technical Strength Lifts Welspun Enterprises Ltd to 52-Week High of Rs 639
With a decisive intraday peak at Rs 639 on 17 Jul 2026, Welspun Enterprises Ltd has surged to a fresh 52-week high, marking a significant milestone in its price momentum journey over the past year.
Read full news article Announcements
Welspun Enterprises Limited - Allotment of ESOP/ESPS
21-Nov-2019 | Source : NSEWelspun Enterprises Limited has informed the Exchange regarding allotment of 375000 Equity Shares under ESOP
Welspun Enterprises Limited - Updates
18-Nov-2019 | Source : NSEWelspun Enterprises Limited has informed the Exchange regarding 'Reclassification of promoter. '.
Welspun Enterprises Limited - Updates
15-Nov-2019 | Source : NSEWelspun Enterprises Limited has informed the Exchange regarding 'Intimation w.r.t. request received for Re-classification of Promoters under Regulation 31A of the SEBI (Listing Obligations and Disclosure Requirements) Regulations, 2015. '.
Corporate Actions

No Upcoming Board Meetings

Welspun Enterprises Ltd has declared 30% dividend, ex-date: 03 Jul 26

No Splits history available

No Bonus history available

No Rights history available
Quality key factors
Valuation key factors
Technicals key factors
 Technical Indicator Scale: Bearish, Mildly Bearish, Sideways, Mildly Bullish, Bullish Turned
 Shareholding Snapshot : Jun 2026
Shareholding Compare (%holding)
Promoters
None
Held by 6 Schemes (4.95%)
Held by 96 FIIs (3.91%)
Balkrishan Goenka Trustee Of Welspun Group Master Trust (49.98%)
Quant Mutual Fund-quant Small Cap Fund (4.85%)
19.49%
Quarterly Results Snapshot (Consolidated) - Mar'26 - YoY

YoY Growth in quarter ended Mar 2026 is 13.81% vs 28.36% in Mar 2025

YoY Growth in quarter ended Mar 2026 is 53.05% vs 35.58% in Mar 2025
Half Yearly Results Snapshot (Consolidated) - Sep'25
Growth in half year ended Sep 2025 is -6.66% vs 29.81% in Sep 2024
Growth in half year ended Sep 2025 is 15.74% vs 1.78% in Sep 2024
Nine Monthly Results Snapshot (Consolidated) - Dec'25
YoY Growth in nine months ended Dec 2025 is -8.54% vs 28.77% in Dec 2024
YoY Growth in nine months ended Dec 2025 is -10.01% vs 1.18% in Dec 2024
Annual Results Snapshot (Consolidated) - Mar'26
YoY Growth in year ended Mar 2026 is -2.16% vs 28.66% in Mar 2025
YoY Growth in year ended Mar 2026 is 8.47% vs 9.31% in Mar 2025
About Welspun Enterprises Ltd

Company Coordinates


