
Compare Welspun Investme with Similar Stocks
Dashboard
The company is Net-Debt Free
Healthy long term growth as Net Sales has grown by an annual rate of 30.77%
Flat results in Mar 26
With ROE of 0.4, it has a Very Expensive valuation with a 0.9 Price to Book Value
Despite the size of the company, domestic mutual funds hold only 0.02% of the company
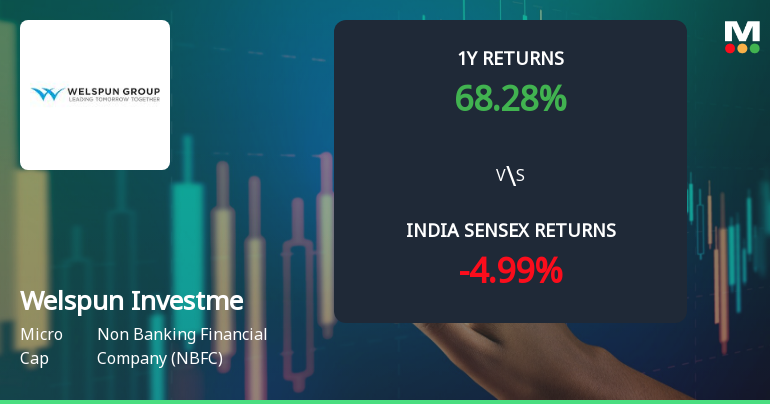
Consistent Returns over the last 3 years
Stock DNA
Non Banking Financial Company (NBFC)
INR 682 Cr (Micro Cap)
211.00
26
0.00%
0.00
0.41%
0.88
Total Returns (Price + Dividend) 
Welspun Investme for the last several years.
Risk Adjusted Returns v/s
Returns Beta

News
Welspun Investments & Commercials Ltd Shows Bullish Momentum Amid Technical Upgrades
Welspun Investments & Commercials Ltd, a micro-cap player in the Non Banking Financial Company (NBFC) sector, has witnessed a notable shift in its technical momentum, upgrading from a mildly bullish to a bullish trend. This change is underpinned by a mix of positive signals from key technical indicators including moving averages, Bollinger Bands, and the KST oscillator, signalling renewed investor interest despite a recent day decline of 1.67%.
Read full news article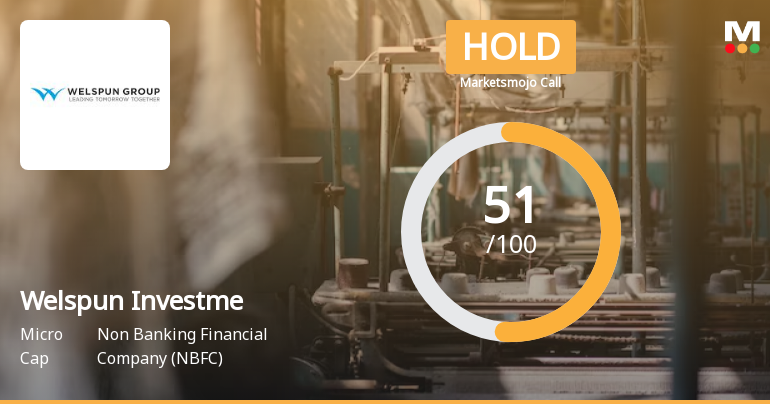
Welspun Investments & Commercials Ltd is Rated Hold
Welspun Investments & Commercials Ltd is rated 'Hold' by MarketsMOJO, with this rating last updated on 25 May 2026. However, the analysis and financial metrics discussed here reflect the company’s current position as of 12 July 2026, providing investors with the most recent insights into its performance and outlook.
Read full news article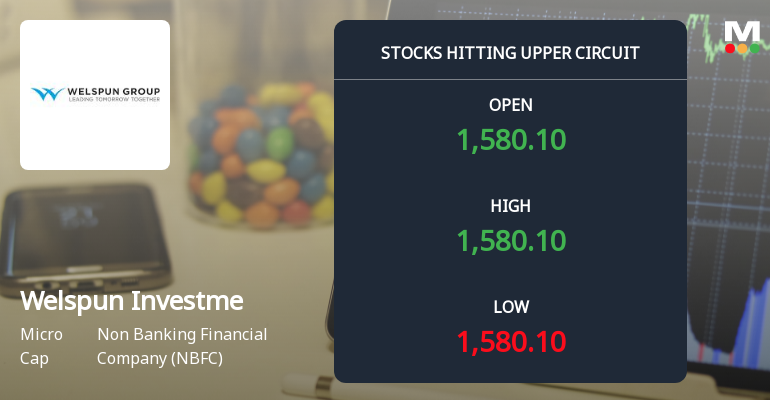
Welspun Investments & Commercials Ltd Locks at Upper Circuit With 5.0% Gain — Buyers Queue, Sellers Absent
At Rs 1794, the buying was done — not because demand dried up, but because the exchange wouldn't let the stock go any higher. Welspun Investments & Commercials Ltd locked at its upper circuit of 5.0% on 1 Jul 2026, with buyers queuing and no sellers willing to part with shares.
Read full news article Announcements
Shareholders meeting
13-Aug-2019 | Source : NSE
| Welspun Investments and Commercials Limited has submitted the Exchange a copy Srutinizers report of Annual General Meeting held on August 12, 2019. Further, the company has informed the Exchange regarding voting results. |
Financial Result Updates
07-Aug-2019 | Source : NSE
| Welspun Investments and Commercials Limited has submitted to the Exchange, the financial results for the period ended June 30, 2019. |
Trading Window
28-Jun-2019 | Source : NSE
| Welspun Investments and Commercials Limited has informed the Exchange regarding the Trading Window closure pursuant to SEBI (Prohibition of Insider Trading) Regulations, 2015 |
Corporate Actions

No Upcoming Board Meetings

No Dividend history available

No Splits history available

No Bonus history available

No Rights history available
Quality key factors
Valuation key factors
Technicals key factors
 Technical Indicator Scale: Bearish, Mildly Bearish, Sideways, Mildly Bullish, Bullish Turned
 Shareholding Snapshot : Mar 2026
Shareholding Compare (%holding)
Promoters
None
Held by 3 Schemes (0.01%)
Held by 0 FIIs
Balkrishan Goenka, Trustee Of Welspun Group Master Trust (73.35%)
Ravi Vasudeo Goenka (3.11%)
15.26%
Quarterly Results Snapshot (Standalone) - Mar'26 - YoY

YoY Growth in quarter ended Mar 2026 is 116.67% vs -40.00% in Mar 2025

YoY Growth in quarter ended Mar 2026 is 0.00% vs 100.00% in Mar 2025
Half Yearly Results Snapshot (Standalone) - Sep'25
Growth in half year ended Sep 2025 is -1.20% vs 28.87% in Sep 2024
Growth in half year ended Sep 2025 is -9.62% vs 30.47% in Sep 2024
Nine Monthly Results Snapshot (Standalone) - Dec'25
YoY Growth in nine months ended Dec 2025 is -2.31% vs 29.10% in Dec 2024
YoY Growth in nine months ended Dec 2025 is -14.82% vs 30.63% in Dec 2024
Annual Results Snapshot (Standalone) - Mar'26
YoY Growth in year ended Mar 2026 is -0.95% vs 27.12% in Mar 2025
YoY Growth in year ended Mar 2026 is -18.11% vs 33.09% in Mar 2025
About Welspun Investments & Commercials Ltd

Company Coordinates


