
Compare West Coast Paper with Similar Stocks
Dashboard
High Management Efficiency with a high ROE of 17.91%
Company has a Debt to Equity ratio (avg) of 0.01 times
Healthy long term growth as Operating profit has grown by an annual rate 47.77%
Flat results in Mar 26
With ROE of 4.2, it has a Very Expensive valuation with a 0.9 Price to Book Value
Majority shareholders : Promoters
With its market cap of Rs 3,432 cr, it is the second biggest company in the sector (behind JK Paper)and constitutes 14.69% of the entire sector
Stock DNA
Paper, Forest & Jute Products
INR 3,442 Cr (Small Cap)
23.00
17
0.96%
-0.24
4.17%
0.95
Total Returns (Price + Dividend) 
Latest dividend: 4.98051282051282 per share ex-dividend date: Aug-14-2025
Risk Adjusted Returns v/s
Returns Beta

News
West Coast Paper Mills Ltd is Rated Hold
West Coast Paper Mills Ltd is rated 'Hold' by MarketsMOJO, with this rating last updated on 29 May 2026. However, the analysis and financial metrics discussed here reflect the stock's current position as of 11 June 2026, providing investors with an up-to-date perspective on the company’s performance and outlook.
Read full news article
West Coast Paper Mills Ltd: Valuation Shift Signals Caution for Investors
West Coast Paper Mills Ltd has experienced a notable shift in its valuation parameters, moving from a 'very expensive' to an 'expensive' rating, prompting a reassessment of its price attractiveness amid evolving market dynamics and peer comparisons.
Read full news article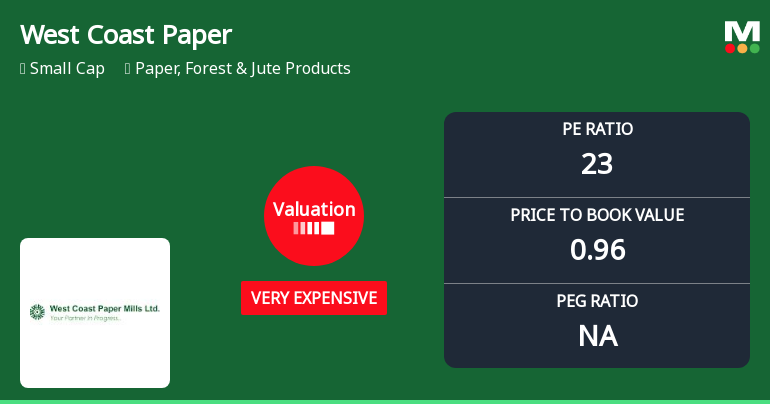
West Coast Paper Mills Ltd Valuation Shifts Amid Market Outperformance
West Coast Paper Mills Ltd has seen a notable shift in its valuation parameters, moving from an expensive to a very expensive rating despite delivering robust returns well above the Sensex over multiple time frames. This article analyses the recent changes in key valuation metrics such as the price-to-earnings (P/E) and price-to-book value (P/BV) ratios, compares them with industry peers, and assesses the implications for investors amid evolving market dynamics.
Read full news article Announcements
West Coast Paper Mills Limited - Other General Purpose
05-Dec-2019 | Source : NSEWest Coast Paper Mills Limited has informed the Exchange regarding Regulation 23(9) of SEBI ( LODR) Regulation 2015-Related party Transactions.
West Coast Paper Mills Limited - Clarification
18-Nov-2019 | Source : NSEWest Coast Paper Mills Limited with respect to announcement dated 12-Nov-2019, regarding Appointment of Mr Virendraa Bangur as Non- Executive Director of the company w.e.f. November 12, 2019. On basis of above the Company is required to clarify following: 1. Disclosure of relationships between directorsá
Credit Rating
30-Aug-2019 | Source : NSE
| West Coast Paper Mills Limited has informed the Exchange regarding Credit Rating |
Corporate Actions

No Upcoming Board Meetings

West Coast Paper Mills Ltd has declared 250% dividend, ex-date: 14 Aug 25

West Coast Paper Mills Ltd has announced 2:10 stock split, ex-date: 26 Oct 07

No Bonus history available

No Rights history available
Quality key factors
Valuation key factors
Technicals key factors
 Technical Indicator Scale: Bearish, Mildly Bearish, Sideways, Mildly Bullish, Bullish Turned
 Shareholding Snapshot : Mar 2026
Shareholding Compare (%holding)
Promoters
None
Held by 7 Schemes (11.61%)
Held by 58 FIIs (3.24%)
Veer Enterprises Limited (16.27%)
Nippon Life India Trustee Ltd-a/c Nippon India Small Cap Fund (5.09%)
20.79%
Quarterly Results Snapshot (Consolidated) - Mar'26 - QoQ

QoQ Growth in quarter ended Mar 2026 is 20.22% vs -0.69% in Dec 2025
QoQ Growth in quarter ended Mar 2026 is 93.04% vs 53.57% in Dec 2025
Half Yearly Results Snapshot (Consolidated) - Sep'25
Growth in half year ended Sep 2025 is -0.37% vs -14.03% in Sep 2024

Growth in half year ended Sep 2025 is -64.58% vs -53.48% in Sep 2024
Nine Monthly Results Snapshot (Consolidated) - Dec'25
YoY Growth in nine months ended Dec 2025 is 0.41% vs -10.56% in Dec 2024
YoY Growth in nine months ended Dec 2025 is -63.04% vs -53.31% in Dec 2024
Annual Results Snapshot (Consolidated) - Mar'26
YoY Growth in year ended Mar 2026 is 5.33% vs -8.66% in Mar 2025
YoY Growth in year ended Mar 2026 is -51.60% vs -55.04% in Mar 2025
About West Coast Paper Mills Ltd

Company Coordinates


