
Compare Western Carriers with Similar Stocks
Dashboard
Weak Long Term Fundamental Strength with a -18.95% CAGR growth in Operating Profits over the last 5 years
- The company has been able to generate a Return on Equity (avg) of 6.17% signifying low profitability per unit of shareholders funds
Negative results in Mar 26
Below par performance in long term as well as near term
Stock DNA
Transport Services
INR 986 Cr (Micro Cap)
26.00
35
0.00%
0.22
4.48%
1.09
Total Returns (Price + Dividend) 
Western Carriers for the last several years.
Risk Adjusted Returns v/s
Returns Beta

News

Western Carriers (India) Ltd is Rated Strong Sell
Western Carriers (India) Ltd is rated Strong Sell by MarketsMOJO. This rating was last updated on 02 Mar 2026. However, the analysis and financial metrics discussed here reflect the stock’s current position as of 10 June 2026, providing investors with the latest insights into the company’s performance and outlook.
Read full news article
Western Carriers (India) Ltd is Rated Strong Sell
Western Carriers (India) Ltd is rated Strong Sell by MarketsMOJO, with this rating last updated on 02 Mar 2026. However, the analysis and financial metrics discussed here reflect the company’s current position as of 30 May 2026, providing investors with the latest insights into the stock’s fundamentals, valuation, financial trends, and technical outlook.
Read full news article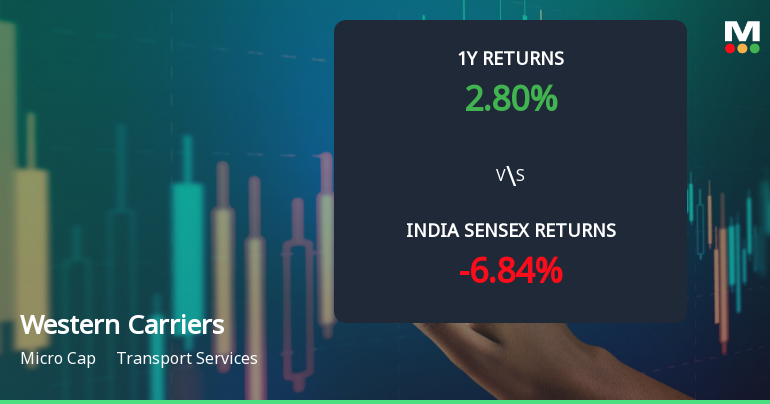
Western Carriers (India) Ltd Technical Momentum Shifts Amid Bearish Sentiment
Western Carriers (India) Ltd, a micro-cap player in the transport services sector, has exhibited a subtle shift in its technical momentum, moving from a bearish to a mildly bearish trend. Despite a modest day change of 0.10% to close at ₹97.25, the stock’s technical indicators present a complex picture, with some signals suggesting cautious optimism while others maintain a bearish undertone.
Read full news article Announcements
Disclosure Under Regulation 29 (2) Of Securities And Exchange Board Of India (Substantial Acquisition Of Shares And Takeovers) Regulations 2011
06-Jun-2026 | Source : BSEMr. Rajendra Sethia Promoter Chairman and Managing Director of the Company has acquired equity shares of the Company from open market.
Intimation Of Award Received
06-Jun-2026 | Source : BSEWestern Carriers (India) Limited is honoured with the Multimodal Logistics Excellence award.
Compliances-Reg.24(A)-Annual Secretarial Compliance
30-May-2026 | Source : BSEAnnual Secretarial Compliance Report for the year ended March 31 2026
Corporate Actions

No Upcoming Board Meetings

No Dividend history available

No Splits history available

No Bonus history available

No Rights history available
Quality key factors
Valuation key factors
Technicals key factors
 Technical Indicator Scale: Bearish, Mildly Bearish, Sideways, Mildly Bullish, Bullish Turned
 Shareholding Snapshot : Mar 2026
Shareholding Compare (%holding)
Promoters
None
Held by 1 Schemes (0.98%)
Held by 4 FIIs (0.04%)
Rajendra Sethia (72.77%)
Aditya Birla Sun Life Insurance Company Limited (3.77%)
17.02%
Quarterly Results Snapshot (Consolidated) - Mar'26 - QoQ

QoQ Growth in quarter ended Mar 2026 is 3.69% vs 8.75% in Dec 2025
QoQ Growth in quarter ended Mar 2026 is -23.73% vs 21.01% in Dec 2025
Half Yearly Results Snapshot (Consolidated) - Sep'25
Growth in half year ended Sep 2025 is 0.15% vs 3.23% in Sep 2024
Growth in half year ended Sep 2025 is -47.89% vs 5.87% in Sep 2024
Nine Monthly Results Snapshot (Consolidated) - Dec'25

YoY Growth in nine months ended Dec 2025 is 2.80% vs 1.01% in Dec 2024
YoY Growth in nine months ended Dec 2025 is -40.15% vs -9.07% in Dec 2024
Annual Results Snapshot (Consolidated) - Mar'26
YoY Growth in year ended Mar 2026 is 6.00% vs 2.37% in Mar 2025
YoY Growth in year ended Mar 2026 is -40.40% vs -18.94% in Mar 2025
About Western Carriers (India) Ltd

Company Coordinates


