
Compare Westlife Food with Similar Stocks
Dashboard
High Debt Company with a Debt to Equity ratio (avg) of 2.30 times
- High Debt Company with a Debt to Equity ratio (avg) of 2.30 times
- The company has been able to generate a Return on Equity (avg) of 6.70% signifying low profitability per unit of shareholders funds
Flat results in Mar 26
With ROE of -0.4, it has a Expensive valuation with a 12.5 Price to Book Value
Consistent Underperformance against the benchmark over the last 3 years
Stock DNA
Leisure Services
INR 7,708 Cr (Small Cap)
NA (Loss Making)
22
0.15%
2.89
-0.38%
12.54
Total Returns (Price + Dividend) 
Latest dividend: 0.7406258810262193 per share ex-dividend date: Aug-04-2025
Risk Adjusted Returns v/s
Returns Beta

News
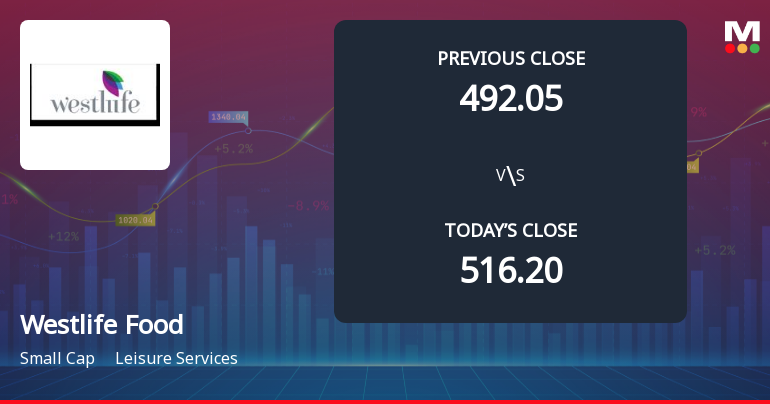

Westlife Foodworld Ltd Surges 12.61% to Day's High of Rs 508.55 — Outperforms Sector by 11.97 Percentage Points
The Sensex declined 0.26% on 21 Jul 2026, while Westlife Foodworld Ltd surged 12.61%, marking a striking 11.97-percentage-point outperformance over its Leisure Services sector peers. This sharp intraday gain rewrites the short-term narrative for the stock, which had been under pressure in recent sessions.
Read full news article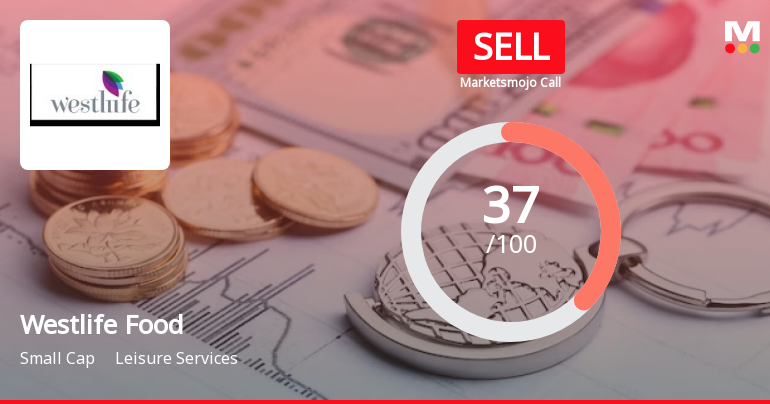
Westlife Foodworld Ltd is Rated Sell
Westlife Foodworld Ltd is rated 'Sell' by MarketsMOJO, with this rating last updated on 04 February 2026. However, the analysis and financial metrics discussed here reflect the stock's current position as of 16 July 2026, providing investors with an up-to-date view of the company’s performance and outlook.
Read full news article Announcements
Announcement under Regulation 30 (LODR)-Analyst / Investor Meet - Intimation
09-Jul-2026 | Source : BSEIntimation of Earnings Conference Call scheduled to be held on 30th July 2026.
Board Meeting Intimation for Considering And Approving Unaudited Financial Results For The Quarter Ended 30 June 2026.
09-Jul-2026 | Source : BSEWestlife Foodworld Ltdhas informed BSE that the meeting of the Board of Directors of the Company is scheduled on 30/07/2026 inter alia to consider and approve Unaudited Financial Result for the quarter ended on 30th June 2026.
Closure of Trading Window
24-Jun-2026 | Source : BSEIntimation of Trading Window Closure of the Company
Corporate Actions

30 Jul 2026

Westlife Foodworld Ltd has declared 37% dividend, ex-date: 04 Aug 25

Westlife Foodworld Ltd has announced 2:10 stock split, ex-date: 12 Jun 13

Westlife Foodworld Ltd has announced 1:1 bonus issue, ex-date: 07 Dec 12

No Rights history available
Quality key factors
Valuation key factors
Technicals key factors
 Technical Indicator Scale: Bearish, Mildly Bearish, Sideways, Mildly Bullish, Bullish Turned
 Shareholding Snapshot : Jun 2026
Shareholding Compare (%holding)
Promoters
None
Held by 16 Schemes (24.08%)
Held by 102 FIIs (6.93%)
Horizon Impex Pvt Ltd (30.49%)
Sbi Equity Hybrid Fund (9.79%)
7.3%
Quarterly Results Snapshot (Consolidated) - Mar'26 - QoQ

QoQ Growth in quarter ended Mar 2026 is -2.29% vs 4.50% in Dec 2025

QoQ Growth in quarter ended Mar 2026 is 133.33% vs -96.32% in Dec 2025
Half Yearly Results Snapshot (Consolidated) - Sep'25
Growth in half year ended Sep 2025 is 5.28% vs 0.41% in Sep 2024
Growth in half year ended Sep 2025 is 701.66% vs -92.95% in Sep 2024
Nine Monthly Results Snapshot (Consolidated) - Dec'25
YoY Growth in nine months ended Dec 2025 is 4.35% vs 3.20% in Dec 2024
YoY Growth in nine months ended Dec 2025 is 182.11% vs -84.48% in Dec 2024
Annual Results Snapshot (Consolidated) - Mar'26
YoY Growth in year ended Mar 2026 is 5.39% vs 4.16% in Mar 2025
YoY Growth in year ended Mar 2026 is 166.09% vs -82.44% in Mar 2025
About Westlife Foodworld Ltd

Company Coordinates


