
Compare Windlas Biotech with Similar Stocks
Stock DNA
Pharmaceuticals & Biotechnology
INR 1,670 Cr (Small Cap)
25.00
34
0.72%
-0.40
11.44%
2.89
Total Returns (Price + Dividend) 
Latest dividend: 5.8 per share ex-dividend date: Jul-21-2025
Risk Adjusted Returns v/s
Returns Beta

News

Windlas Biotech Ltd is Rated Sell
Windlas Biotech Ltd is rated 'Sell' by MarketsMOJO, with this rating last updated on 05 February 2026. However, the analysis and financial metrics discussed below reflect the stock's current position as of 17 June 2026, providing investors with an up-to-date view of the company’s fundamentals, returns, and market performance.
Read full news article
Windlas Biotech Ltd is Rated Sell
Windlas Biotech Ltd is rated 'Sell' by MarketsMOJO, with this rating last updated on 05 February 2026. However, the analysis and financial metrics discussed below reflect the stock's current position as of 08 June 2026, providing investors with an up-to-date view of the company’s fundamentals, returns, and market standing.
Read full news article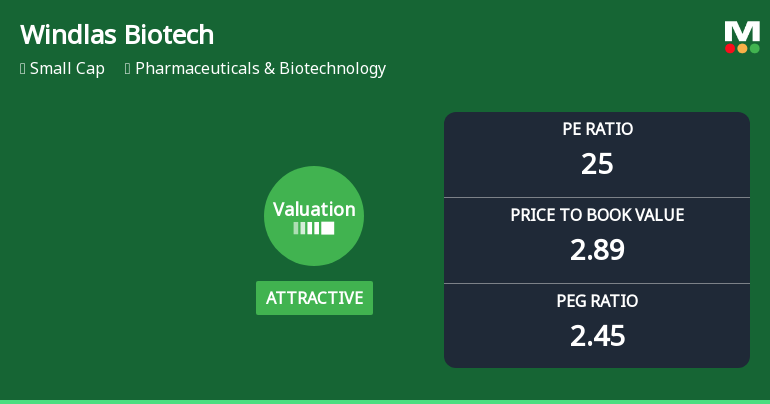
Windlas Biotech Ltd Valuation Shifts Signal Renewed Price Attractiveness
Windlas Biotech Ltd has witnessed a notable shift in its valuation parameters, moving from a fair to an attractive rating despite a recent downgrade in its overall Mojo Grade to Sell. This recalibration in price-to-earnings and price-to-book value metrics, when analysed against historical trends and peer benchmarks, suggests a nuanced investment opportunity within the Pharmaceuticals & Biotechnology sector.
Read full news article Announcements
Announcement under Regulation 30 (LODR)-Earnings Call Transcript
28-May-2026 | Source : BSEQ4 & FY26 Earnings Conference Call Transcript
Compliances-Reg.24(A)-Annual Secretarial Compliance
26-May-2026 | Source : BSEAnnual Secretarial Compliance Report for the financial year ended March 31 2026
Intimation Under Regulation 30 Of The SEBI (Listing Obligations And Disclosure Requirements) Regulations 2015 - Recording Of Conference Call
22-May-2026 | Source : BSEAudio recording of Investors/ Analyst conference call on the audited consolidated and standalone financial results of the Company for the quarter and financial year ended March 31 2026.
Corporate Actions

No Upcoming Board Meetings

Windlas Biotech Ltd has declared 116% dividend, ex-date: 21 Jul 25

No Splits history available

No Bonus history available

No Rights history available
Quality key factors
Valuation key factors
Technicals key factors
 Technical Indicator Scale: Bearish, Mildly Bearish, Sideways, Mildly Bullish, Bullish Turned
 Shareholding Snapshot : May 2026
Shareholding Compare (%holding)
Promoters
None
Held by 4 Schemes (6.41%)
Held by 31 FIIs (0.99%)
Akw Wbl Family Private Trust (through Its Trustees Ashok Vimla Trusteeship Services Private Limited) (40.61%)
Icici Prudential Pharma Healthcare And Diaganostics (p.h.d) Fund (4.42%)
21.1%
Quarterly Results Snapshot (Consolidated) - Mar'26 - QoQ

QoQ Growth in quarter ended Mar 2026 is 2.32% vs 4.81% in Dec 2025

QoQ Growth in quarter ended Mar 2026 is 6.60% vs -15.73% in Dec 2025
Half Yearly Results Snapshot (Consolidated) - Sep'25
Growth in half year ended Sep 2025 is 19.42% vs 21.75% in Sep 2024
Growth in half year ended Sep 2025 is 21.69% vs 11.65% in Sep 2024
Nine Monthly Results Snapshot (Consolidated) - Dec'25
YoY Growth in nine months ended Dec 2025 is 19.46% vs 21.21% in Dec 2024
YoY Growth in nine months ended Dec 2025 is 12.84% vs 8.54% in Dec 2024
Annual Results Snapshot (Consolidated) - Mar'26
YoY Growth in year ended Mar 2026 is 18.98% vs 20.43% in Mar 2025
YoY Growth in year ended Mar 2026 is 8.97% vs 4.81% in Mar 2025
About Windlas Biotech Ltd

Company Coordinates


