
Compare Wipro with Similar Stocks
Stock DNA
Computers - Software & Consulting
INR 187,121 Cr (Large Cap)
14.00
20
6.10%
-0.39
14.99%
2.15
Total Returns (Price + Dividend) 
Latest dividend: 6 per share ex-dividend date: Jan-27-2026
Risk Adjusted Returns v/s
Returns Beta

News
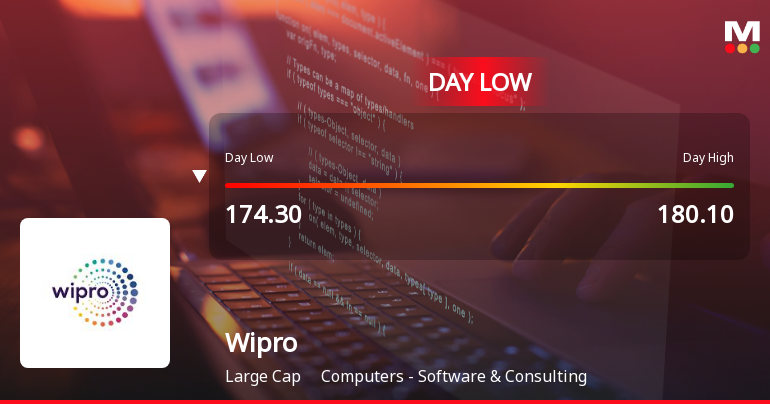
Wipro Ltd. Hits Intraday Low Amid Price Pressure on 23 Jun 2026
Wipro Ltd. experienced a notable decline today, touching an intraday low of Rs 174.6, marking a fresh 52-week low as the stock faced significant price pressure amid broader market weakness and sector underperformance.
Read full news article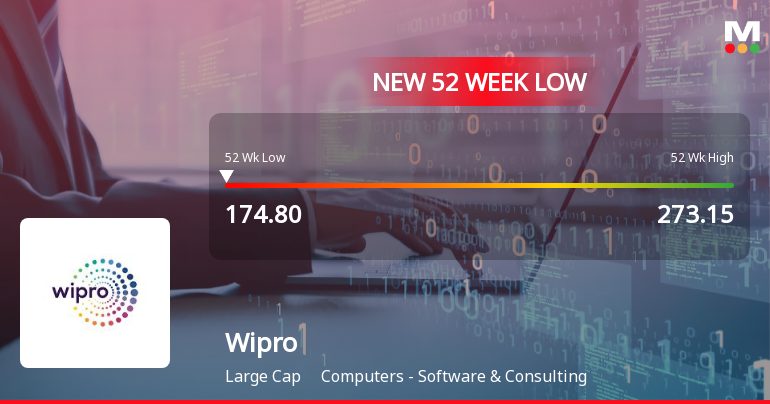
Markets Rally, But Wipro Ltd. Sinks to 52-Week Low in Stock-Specific Sell-Off
For the fourth consecutive session, Wipro Ltd. has closed lower, culminating in a fresh 52-week low of Rs 174.8 on 23 Jun 2026, marking a 5.18% decline over this period amid broader market weakness.
Read full news article
Wipro Ltd. Downgraded to Sell Amidst Weak Technicals and Flat Financials
Wipro Ltd., a major player in the Computers - Software & Consulting sector, has seen its investment rating downgraded from Hold to Sell as of 22 June 2026. This decision follows a comprehensive reassessment across four critical parameters: Quality, Valuation, Financial Trend, and Technicals. Despite some strengths such as high management efficiency and net debt-free status, the overall outlook has deteriorated due to flat recent financial performance, weak technical indicators, and underwhelming long-term returns.
Read full news article Announcements
Wipro Limited - ESOP/ESOS/ESPS
05-Dec-2019 | Source : NSEWipro Limited has informed the Exchange regarding Grant of 30000 Options.
Wipro Limited - Allotment of ESOP/ESPS
18-Nov-2019 | Source : NSEWipro Limited has informed the Exchange regarding allotment of 28134 Equity Shares under ESOP
Wipro Limited - Press Release
15-Nov-2019 | Source : NSEWipro Limited has informed the Exchange regarding a press release dated November 14, 2019, titled "Topcoder Unveils Talent-as-a-Service On-Demand Workforce Model".
Corporate Actions

No Upcoming Board Meetings

Wipro Ltd. has declared 300% dividend, ex-date: 27 Jan 26

No Splits history available

Wipro Ltd. has announced 1:1 bonus issue, ex-date: 03 Dec 24

No Rights history available
Quality key factors
Valuation key factors
Technicals key factors
 Technical Indicator Scale: Bearish, Mildly Bearish, Sideways, Mildly Bullish, Bullish Turned
 Shareholding Snapshot : Mar 2026
Shareholding Compare (%holding)
Promoters
None
Held by 33 Schemes (4.31%)
Held by 830 FIIs (8.32%)
Mr Azim Hasham Premji Partner Representing Zash Traders (21.0%)
Lici Ulip-growth Fund (2.67%)
6.6%
Quarterly Results Snapshot (Consolidated) - Mar'26 - YoY

YoY Growth in quarter ended Mar 2026 is 7.70% vs 1.33% in Mar 2025

YoY Growth in quarter ended Mar 2026 is -1.90% vs 25.93% in Mar 2025
Half Yearly Results Snapshot (Consolidated) - Sep'25
Growth in half year ended Sep 2025 is 1.28% vs -2.38% in Sep 2024
Growth in half year ended Sep 2025 is 5.87% vs 12.61% in Sep 2024
Nine Monthly Results Snapshot (Consolidated) - Dec'25
YoY Growth in nine months ended Dec 2025 is 2.71% vs -1.43% in Dec 2024
YoY Growth in nine months ended Dec 2025 is 1.36% vs 16.51% in Dec 2024
Annual Results Snapshot (Consolidated) - Mar'26
YoY Growth in year ended Mar 2026 is 3.97% vs -0.75% in Mar 2025
YoY Growth in year ended Mar 2026 is 0.47% vs 18.92% in Mar 2025
About Wipro Ltd.

Company Coordinates


