Wonderla Holiday

  • Market Cap: Small Cap
  • Industry: Leisure Services
  • ISIN: INE066O01014
  • NSEID: WONDERLA
  • BSEID: 538268
INR
489.90
9 (1.87%)
BSENSE

Aug 20, 04:01 PM

BSE+NSE Vol: 8.21 lacs

  • Price Points
  • Score
  • Mojo Parameters
  • Total Return
  • News and Corporate Actions
  • Key factors
  • Shareholding
  • Financials
  • CompanyCV
stock-summaryPrice Point
High/Low

1Day

52 Week

Valuation
Technical
Day's Volume

CASH

8.21 lacs (580.62%) Volume

Shareholding (Jun 2026)

FII

4.20%

Held by 52 FIIs

DII

11.27%

Held by 12 DIIs

Promoter

62.22%

Why is Wonderla Holidays Ltd falling/rising?

20-Aug-2026

As of 19-Aug, Wonderla Holidays Ltd's stock price is rising to 483.95, up 1.83%, driven by recent positive trends, increased investor participation, and strong financial fundamentals despite a year-to-date decline. The stock's performance is supported by a favorable outlook in the broader amusement sector and significant growth in net sales.

As of 19-Aug, Wonderla Holidays Ltd's stock price is rising, currently at 483.95, reflecting an increase of 8.7 (1.83%). This upward movement can be attributed to several factors. Firstly, the stock has shown a positive trend over the last three days, gaining 3.37% during this period. Additionally, the stock reached an intraday high of Rs 485, indicating strong buying interest. <BR><BR>Investor participation has also increased, with delivery volume rising by 39.53% compared to the five-day average, suggesting heightened interest in the stock. Furthermore, the broader sector of Amusement Parks/Recreation/Club has performed well, gaining 2.75%, which may positively influence investor sentiment towards Wonderla Holidays Ltd.<BR><BR>Despite the stock's year-to-date performance showing a decline of 8.09%, the company's fundamentals remain strong. It is net-debt free and has reported significant growth in net sales, with a year-on-year increase of 44.22%. These positive financial indicators contribute to a favorable outlook for the stock, even amidst its historical underperformance over the past year. Overall, the combination of recent gains, increased investor activity, and solid financial health supports the stock's rising price.

View full answer

Who are in the management team of Wonderla Holiday?

14-Aug-2026

The management team of Wonderla Holiday includes M Ramachandran (Chairman), Arun K Chittilappilly (Managing Director), R Lakshminarayanan (Vice Chairman), and several other directors, both independent and non-independent, who guide the company's strategic direction.

The management team of Wonderla Holiday includes the following key members:<BR><BR>1. **M Ramachandran** - Chairman & Independent Director<BR>2. **Arun K Chittilappilly** - Executive Director, Managing Director, and Promoter<BR>3. **R Lakshminarayanan** - Vice Chairman<BR>4. **George Joseph** - Non-Executive & Non-Independent Director<BR>5. **Priya Sarah Cheeran Joseph** - Non-Executive & Non-Independent Director<BR>6. **Gopal Srinivasan** - Non-Executive & Non-Independent Director<BR>7. **Anjali Nair** - Independent Director<BR>8. **K Ullas Kamath** - Independent Director<BR>9. **Kochouseph Chittilappilly** - Chairman Emeritus<BR>10. **Madan Padaki** - Independent Non-Executive Director<BR><BR>This team plays a crucial role in guiding the company's strategic direction and operations.

View full answer

What does Wonderla Holiday do?

14-Aug-2026

Wonderla Holidays Ltd operates amusement parks and entertainment services, categorized as a small-cap company with a market cap of INR 2,984 Cr. As of June 2026, it reported net sales of 243 Cr and a net profit of 73 Cr.

Overview:<BR>Wonderla Holidays Ltd operates in the leisure services industry, focusing on amusement parks and related entertainment activities, and is categorized as a small-cap company.<BR><BR>History:<BR>Wonderla Holidays Ltd was originally incorporated as a Private Limited Company in Bangalore on November 18, 2002. The amusement park in Kochi was established as a Public Limited Company on February 3, 1998, and underwent several status changes, including a conversion to a Private Limited Company on July 4, 2001. The latest quarterly results reported net sales and net profit for June 2026.<BR><BR>Financial Snapshot:<BR>- Net Sales: 243 Cr (Quarterly Results - Jun 2026)<BR>- Net Profit: 73 Cr (Quarterly Results - Jun 2026)<BR>- Market Cap: INR 2,984 Cr (Small Cap)<BR><BR>Key Metrics:<BR>- P/E: 28.00<BR>- Industry P/E: 34<BR>- Dividend Yield: 0.42%<BR>- Debt Equity: -0.23<BR>- Return on Equity: 5.89%<BR>- Price to Book: 1.66<BR><BR>Contact Details:<BR>Address: 28th KM, Mysore Road Bangalore Karnataka : 562109<BR>Tel: 91-80-22010333<BR>Email: investors@wonderla.com<BR>Website: http://www.wonderla.com

View full answer

Who are the peers of the Wonderla Holiday?

14-Aug-2026

Wonderla Holiday's peers include Westlife Food, Sapphire Foods, Restaurant Brand, United Foodbrand, Imagica. Enter., Delta Corp, Speciality Rest., Coffee Day Enter, and Kaya Ltd. Wonderla has excellent management and capital structure, with a 1-year return of -17.14%, outperforming Sapphire Foods but underperforming United Foodbrand.

Peers: The peers of Wonderla Holiday are Westlife Food, Sapphire Foods, Restaurant Brand, United Foodbrand, Imagica. Enter., Delta Corp, Speciality Rest., Coffee Day Enter, and Kaya Ltd.<BR><BR>Quality Snapshot: Excellent management risk is observed at Wonderla Holiday and Delta Corp, while Average management risk is found at Westlife Food, Sapphire Foods, Speciality Rest., and the rest. Below Average management risk is present at Restaurant Brand, United Foodbrand, Imagica. Enter., Coffee Day Enter, and Kaya Ltd. Growth is rated as Good for Wonderla Holiday, Westlife Food, and Sapphire Foods, while Average growth is seen at Imagica. Enter. and Speciality Rest., with the rest showing Below Average growth. Capital Structure is Excellent for Wonderla Holiday and Delta Corp, Good for Restaurant Brand and Speciality Rest., while Below Average is noted for Westlife Food, Sapphire Foods, United Foodbrand, Coffee Day Enter, and Kaya Ltd.<BR><BR>Return Snapshot: The peer with the highest 1-year return is United Foodbrand at 197.70%, while the lowest is Sapphire Foods at -26.03%. Wonderla Holiday's 1-year return is -17.14%, which is higher than Sapphire Foods but lower than United Foodbrand. Additionally, the six-month return is negative for Delta Corp, Imagica. Enter., Coffee Day Enter, and Kaya Ltd.

View full answer

How big is Wonderla Holiday?

14-Aug-2026

As of 14th August, Wonderla Holidays Ltd has a market capitalization of 2,976.52 Cr and reported net sales of 593.16 Cr and net profit of 101.95 Cr over the latest four quarters.

As of 14th August, <BR><BR>Market Cap: Wonderla Holidays Ltd has a market capitalization of 2,976.52 Cr, classified as a Small Cap company.<BR><BR>Recent Quarterly Performance: The sum of Net Sales for the latest 4 quarters is 593.16 Cr, while the sum of Net Profit for the same period is 101.95 Cr.<BR><BR>Balance Sheet Snapshot: The reporting period is March 2026, with Shareholder's Funds amounting to 1,796.90 Cr and Total Assets totaling 1,946.99 Cr.

View full answer

Are Wonderla Holidays Ltd latest results good or bad?

05-Aug-2026

Wonderla Holidays Ltd's Q1 FY27 results are strong, with a net profit of ₹72.80 crores (up 38.49% year-on-year) and revenue of ₹242.63 crores (up 44.22%). However, concerns remain regarding low return ratios, with ROE at 4.76% and ROCE at 5.88%.

Wonderla Holidays Ltd's latest results for Q1 FY27 are quite strong, indicating a positive performance overall. The company reported a net profit of ₹72.80 crores, which is a significant increase of 38.49% year-on-year. Revenue also saw impressive growth, reaching ₹242.63 crores, up 44.22% compared to the same quarter last year. <BR><BR>Additionally, the operating margin improved to 46.38%, marking the highest level in the past seven quarters, and the profit after tax (PAT) margin reached a record 30.00%. This strong financial performance reflects the company's ability to capitalize on seasonal demand, particularly during the peak summer months when footfall at its amusement parks typically surges.<BR><BR>However, while the operational metrics are impressive, there are some concerns regarding the company's return ratios, which remain below industry expectations. The return on equity (ROE) is currently at 4.76%, and the return on capital employed (ROCE) is at 5.88%, both of which are considered low for a capital-intensive business like this.<BR><BR>In summary, Wonderla Holidays has delivered strong quarterly results, showcasing operational excellence and robust revenue growth, but it faces challenges in capital efficiency that investors should consider.

View full answer

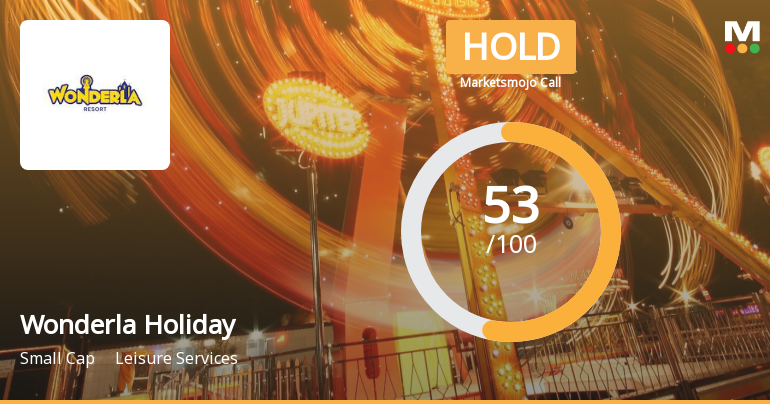
Should I buy, sell or hold Wonderla Holidays Ltd?

05-Aug-2026

When is the next results date for Wonderla Holidays Ltd?

23-Apr-2026

The next results date for Wonderla Holidays Ltd is 07 May 2026.

The next results date for Wonderla Holidays Ltd is scheduled for 07 May 2026.

View full answer

Is Wonderla Holiday overvalued or undervalued?

10-Nov-2025

As of November 7, 2025, Wonderla Holiday is considered very expensive and overvalued, with a PE Ratio of 43.28 and poor stock performance, significantly lagging behind its peers and the Sensex.

As of 7 November 2025, the valuation grade for Wonderla Holiday has moved from expensive to very expensive, indicating a significant shift in its market perception. The company is currently considered overvalued. Key ratios reflect this assessment, with a PE Ratio of 43.28, a Price to Book Value of 0.20, and an EV to EBITDA of -7.14, all suggesting that the stock is trading at a premium relative to its earnings and asset value.<BR><BR>When compared to peers, Wonderla Holiday's valuation appears particularly high. For instance, Imagica Entertainment has a PE Ratio of 122.48, while Nicco Parks stands at 18.32, indicating that Wonderla's valuation is out of sync with its competitors. Additionally, the company's recent stock performance has lagged behind the Sensex, with a year-to-date return of -23.45% compared to the Sensex's 6.50%, further reinforcing the notion that Wonderla Holiday is overvalued in the current market environment.

View full answer

How has been the historical performance of Wonderla Holiday?

09-Nov-2025

Wonderla Holiday's historical performance shows fluctuating financial metrics, with net sales peaking at 483.04 Cr in March 2024 before declining to 458.57 Cr in March 2025, alongside decreases in profits and cash flow, despite significant growth in total assets. Recent trends indicate a need for attention due to declining profitability and cash flow.

Answer:<BR>The historical performance of Wonderla Holiday shows a fluctuating trend in key financial metrics over the years.<BR><BR>Breakdown:<BR>Wonderla Holiday's net sales peaked at 483.04 Cr in March 2024 but declined to 458.57 Cr in March 2025, following a steady increase from 429.22 Cr in March 2023 and a significant rise from 127.55 Cr in March 2022. The total operating income mirrored this trend, reaching 483.04 Cr in March 2024 before falling to 458.57 Cr in March 2025. Operating profit (PBDIT) also saw a decline from 250.16 Cr in March 2024 to 171.40 Cr in March 2025, although it had previously increased from a low of 25.97 Cr in March 2022. Profit before tax decreased from 211.32 Cr in March 2024 to 113.55 Cr in March 2025, while profit after tax followed suit, dropping from 157.96 Cr to 109.27 Cr in the same period. The company's total assets grew significantly from 1,238.31 Cr in March 2024 to 1,861.60 Cr in March 2025, driven by an increase in cash and bank balances from 123.87 Cr to 423.01 Cr. Total liabilities also rose from 1,238.31 Cr to 1,861.60 Cr, with a slight increase in total debt. The cash flow from operating activities decreased from 177.00 Cr in March 2024 to 122.00 Cr in March 2025, while cash flow from investing activities showed a substantial outflow of -644.00 Cr in March 2025, indicating increased capital expenditures. Overall, while Wonderla Holiday has shown growth in assets and sales over the years, recent declines in profits and cash flow warrant attention.

View full answer

Is Wonderla Holiday technically bullish or bearish?

27-Oct-2025

As of October 24, 2025, Wonderla Holiday's technical trend is bearish, supported by negative MACD readings, bearish Bollinger Bands, and a bearish daily moving average, despite a bullish monthly RSI.

As of 24 October 2025, the technical trend has changed from mildly bearish to bearish. The current technical stance for Wonderla Holiday is bearish with a moderate strength. Key indicators driving this stance include the bearish MACD readings on both the weekly and monthly time frames, bearish Bollinger Bands across the same periods, and a bearish daily moving average. Although the monthly RSI shows bullishness, it is overshadowed by the overall bearish signals from the other indicators. The Dow Theory indicates a mildly bearish trend on the weekly chart, further supporting the bearish outlook.

View full answer

Who are the top shareholders of the Wonderla Holiday?

17-Jul-2025

The top shareholders of Wonderla Holiday include promoter Arun K Chittilappilly with 31.88%, mutual funds at 11.17%, Foreign Institutional Investors (FIIs) at 6.73%, and individual investors at 15.12%. There are no pledged promoter holdings reported.

The top shareholders of Wonderla Holiday include the promoters, who hold the majority of the shares. Arun K Chittilappilly is the promoter with the highest holding at 31.88%. Additionally, mutual funds collectively hold 11.17% of the shares, with Tata Mutual Fund - Tata Small Cap Fund being the highest public shareholder at 6.78%. Foreign Institutional Investors (FIIs) hold 6.73%, and individual investors account for 15.12% of the total shareholding. There are no pledged promoter holdings reported.

View full answer

Has Wonderla Holiday declared dividend?

06-Jun-2025

Yes, Wonderla Holidays Ltd has declared a 25% dividend, amounting to ₹2.5 per share, with an ex-date of August 9, 2024. Despite recent declines, the company has shown significant growth in total returns over longer periods.

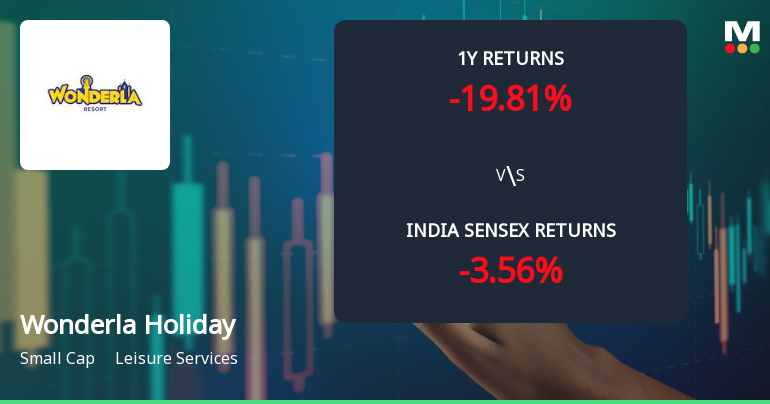
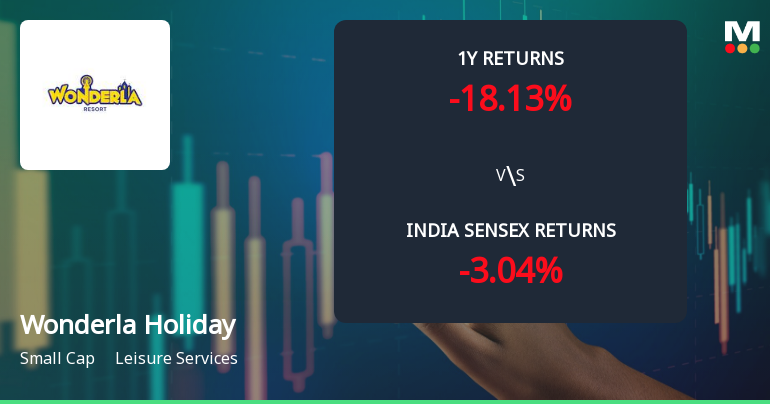
Wonderla Holidays Ltd has declared a 25% dividend.<BR><BR>Dividend Details:<BR>- Percentage announced: 25%<BR>- Amount per share: 2.5<BR>- Ex-date: 09 Aug 24<BR><BR>Dividend Yield: 0.34%.<BR><BR>Total Returns by Period:<BR>In the last 6 months, the price return was -28.0%, the dividend return was 0%, resulting in a total return of -28.0%.<BR><BR>Over the past year, the price return was -23.74%, the dividend return was 0.28%, leading to a total return of -23.46%.<BR><BR>In the 2-year period, the price return was 17.27%, the dividend return was 0.88%, culminating in a total return of 18.15%.<BR><BR>For the last 3 years, the price return was 181.25%, the dividend return was 2.31%, which resulted in a total return of 183.56%.<BR><BR>In the 4-year period, the price return was 206.75%, the dividend return was 2.29%, giving a total return of 209.04%.<BR><BR>Over the last 5 years, the price return was 352.23%, the dividend return was 3.85%, resulting in a total return of 356.08%.<BR><BR>Overall, Wonderla Holidays Ltd has declared a dividend while experiencing mixed total returns over various periods, with significant growth in the longer term despite recent declines in the shorter term.

View full answer
iScoreScore
Click here to find our call on this stock
Strong Sell
Sell
Hold
Buy
Strong Buy

Dashboard

1

The company is Net-Debt Free

 
2

Healthy long term growth as Net Sales has grown by an annual rate of 69.22%

 
3

With a growth in Net Sales of 44.22%, the company declared Very Positive results in Jun 26

4

With ROE of 5.9, it has a Fair valuation with a 1.7 Price to Book Value

5

Falling Participation by Institutional Investors

6

Consistent Underperformance against the benchmark over the last 3 years

stock-summaryMojo Parameters

Mojo Parameters

Loading Valuation Snapshot...

Stock DNA

stock-summary
Industry

Leisure Services

stock-summary
Market cap

INR 3,071 Cr (Small Cap)

stock-summary
P/E

29.00

stock-summary
Industry P/E

21

stock-summary
Dividend Yield

0.41%

stock-summary
Debt Equity

-0.23

stock-summary
Return on Equity

5.89%

stock-summary
Price to Book

1.71

Revenue and Profits:
Net Sales:
243 Cr
(Quarterly Results - Jun 2026)
Net Profit:
73 Cr
stock-summaryTotal Returns
Total Returns (Price + Dividend) stock-summary
Dividend Yield (0.41%)
TimePeriod
Price Return
Dividend Return
Total Return
3 Months
0.66%
0.41%
1.07%
6 Months
0.8%
0.41%
1.21%
1 Year
-21.63%
0.31%
-21.32%
2 Years
-40.14%
0.47%
-39.67%
3 Years
-23.24%
1.03%
-22.21%
4 Years
41.06%
2.54%
43.6%
5 Years
119.69%
3.88%
123.57%

Latest dividend: 1.996763426721958 per share ex-dividend date: Aug-07-2026

Risk Adjusted Returns v/s stock-summary
Returns Beta
Icon
Beta has not been calculated since enough price history is not available
stock-summaryNews & Corporate Actions

Announcements stock-summary

Announcement under Regulation 30 (LODR)-Analyst / Investor Meet - Intimation

11-Aug-2026 | Source : BSE

Investors meeting

Announcement under Regulation 30 (LODR)-Earnings Call Transcript

11-Aug-2026 | Source : BSE

Concall Transcripts

Announcement under Regulation 30 (LODR)-Change in Management

06-Aug-2026 | Source : BSE

Resignation of SMP

Corporate Actions stock-summary

stock-summary
BOARD MEETING

No Upcoming Board Meetings

stock-summary
DIVIDEND

Wonderla Holidays Ltd has declared 20% dividend, ex-date: 07 Aug 26

stock-summary
SPLITS

No Splits history available

stock-summary
BONUS

No Bonus history available

stock-summary
RIGHTS

No Rights history available

stock-summaryKey Factors

Quality key factors stock-summary

Factor
Value
Sales Growth (5y)
69.22%
EBIT Growth (5y)
28.53%
EBIT to Interest (avg)
100.00
Debt to EBITDA (avg)
Net Debt is too low
Net Debt to Equity (avg)
-0.23
Sales to Capital Employed (avg)
0.32
Tax Ratio
22.35%
Dividend Payout Ratio
11.61%
Pledged Shares
0
Institutional Holding
15.47%
ROCE (avg)
10.97%
ROE (avg)
8.24%

Valuation key factors

Factor
Value
P/E Ratio
29
Industry P/E
21
Price to Book Value
1.71
EV to EBIT
25.17
EV to EBITDA
13.24
EV to Capital Employed
1.92
EV to Sales
4.47
PEG Ratio
4.05
Dividend Yield
0.41%
ROCE (Latest)
5.88%
ROE (Latest)
5.89%

Technicals key factors

Indicator
Weekly
Monthly
MACD
Mildly Bullish
Bearish
RSI
No Signal
No Signal
Bollinger Bands
Mildly Bearish
Mildly Bearish
Moving Averages
Mildly Bearish (Daily)
KST
Mildly Bullish
Bearish
Dow Theory
No Trend
Mildly Bullish
OBV
Bearish
Bearish
stock-summary Technical Indicator Scale: Bearish, Mildly Bearish, Sideways, Mildly Bullish, Bullish  Turned 
stock-summaryShareholding
Shareholding Snapshot : Jun 2026stock-summary
Shareholding Compare (%holding) stock-summary
Majority shareholders

Promoters

Pledged Promoter Holdings

None

Mutual Funds

Held by 4 Schemes (10.45%)

FIIs

Held by 52 FIIs (4.2%)

Promoter with highest holding

Arun K Chittilappilly (31.86%)

Highest Public shareholder

Tata Mutual Fund - Tata Small Cap Fund (6.78%)

Individual Investors Holdings

18.16%

stock-summaryFinancial
[
  {
    "link": "quarterly",
    "btn_text": "All Quarterly Results",
    "header": "Quarterly Results Snapshot (Standalone) - Jun'26 - YoY",
    "rhs": [
      {
        "prefix": "Net Sales ",
        "suffix": "YoY Growth in quarter ended Jun 2026 is 44.22% vs -2.70% in Jun 2025",
        "dir": 1
      },
      {
        "prefix": "Standalone Net Profit ",
        "suffix": "YoY Growth in quarter ended Jun 2026 is 38.48% vs -16.87% in Jun 2025",
        "dir": 1
      }
    ],
    "table": {
      "header": [
        "Jun'26",
        "Jun'25",
        "Change(%)"
      ],
      "body": [
        {
          "field": "Net Sales",
          "val1": "242.63",
          "val2": "168.24",
          "chgp": "44.22%",
          "chgp_class": "positive"
        },
        {
          "field": "Operating Profit (PBDIT) excl Other Income",
          "val1": "112.52",
          "val2": "76.68",
          "chgp": "46.74%",
          "chgp_class": "positive"
        },
        {
          "field": "Interest",
          "val1": "0.14",
          "val2": "0.11",
          "chgp": "27.27%",
          "chgp_class": "negative"
        },
        {
          "field": "Exceptional Items",
          "val1": "0.00",
          "val2": "0.00",
          "chgp": "",
          "chgp_class": "neutral"
        },
        {
          "field": "Standalone Net Profit",
          "val1": "72.80",
          "val2": "52.57",
          "chgp": "38.48%",
          "chgp_class": "positive"
        },
        {
          "field": "Operating Profit Margin (Excl OI)",
          "val1": "46.38%",
          "val2": "45.58%",
          "chgp": "0.80%",
          "chgp_class": "positive"
        }
      ]
    }
  },
  {
    "link": "half-yearly",
    "btn_text": "All Half Yearly Results",
    "header": "Half Yearly Results Snapshot (Standalone) - Sep'25",
    "rhs": [
      {
        "prefix": "Net Sales ",
        "suffix": " Growth in half year ended Sep 2025 is 3.38% vs -7.51% in Sep 2024",
        "dir": 1
      },
      {
        "prefix": "Standalone Net Profit ",
        "suffix": " Growth in half year ended Sep 2025 is -34.80% vs -20.45% in Sep 2024",
        "dir": -1
      }
    ],
    "table": {
      "header": [
        "Sep'25",
        "Sep'24",
        "Change(%)"
      ],
      "body": [
        {
          "field": "Net Sales",
          "val1": "248.40",
          "val2": "240.28",
          "chgp": "3.38%",
          "chgp_class": "positive"
        },
        {
          "field": "Operating Profit (PBDIT) excl Other Income",
          "val1": "84.17",
          "val2": "90.29",
          "chgp": "-6.78%",
          "chgp_class": "negative"
        },
        {
          "field": "Interest",
          "val1": "0.23",
          "val2": "0.35",
          "chgp": "-34.29%",
          "chgp_class": "positive"
        },
        {
          "field": "Exceptional Items",
          "val1": "0.00",
          "val2": "0.00",
          "chgp": "",
          "chgp_class": "neutral"
        },
        {
          "field": "Standalone Net Profit",
          "val1": "50.83",
          "val2": "77.96",
          "chgp": "-34.80%",
          "chgp_class": "negative"
        },
        {
          "field": "Operating Profit Margin (Excl OI)",
          "val1": "33.88%",
          "val2": "37.58%",
          "chgp": "-3.70%",
          "chgp_class": "negative"
        }
      ]
    }
  },
  {
    "link": "nine-monthly",
    "btn_text": "All Nine Monthly Results",
    "header": "Nine Monthly Results Snapshot (Standalone) - Dec'25",
    "rhs": [
      {
        "prefix": "Net Sales ",
        "suffix": "YoY Growth in nine months ended Dec 2025 is 5.84% vs -5.63% in Dec 2024",
        "dir": 1
      },
      {
        "prefix": "Standalone Net Profit ",
        "suffix": "YoY Growth in nine months ended Dec 2025 is -33.53% vs -27.41% in Dec 2024",
        "dir": -1
      }
    ],
    "table": {
      "header": [
        "Dec'25",
        "Dec'24",
        "Change(%)"
      ],
      "body": [
        {
          "field": "Net Sales",
          "val1": "382.93",
          "val2": "361.79",
          "chgp": "5.84%",
          "chgp_class": "positive"
        },
        {
          "field": "Operating Profit (PBDIT) excl Other Income",
          "val1": "124.40",
          "val2": "127.45",
          "chgp": "-2.39%",
          "chgp_class": "negative"
        },
        {
          "field": "Interest",
          "val1": "0.49",
          "val2": "0.51",
          "chgp": "-3.92%",
          "chgp_class": "positive"
        },
        {
          "field": "Exceptional Items",
          "val1": "-8.05",
          "val2": "0.00",
          "chgp": "",
          "chgp_class": "neutral"
        },
        {
          "field": "Standalone Net Profit",
          "val1": "65.31",
          "val2": "98.26",
          "chgp": "-33.53%",
          "chgp_class": "negative"
        },
        {
          "field": "Operating Profit Margin (Excl OI)",
          "val1": "32.49%",
          "val2": "35.23%",
          "chgp": "-2.74%",
          "chgp_class": "negative"
        }
      ]
    }
  },
  {
    "link": "annual",
    "btn_text": "All Annual Results",
    "header": "Annual Results Snapshot (Standalone) - Mar'26",
    "rhs": [
      {
        "prefix": "Net Sales ",
        "suffix": "YoY Growth in year ended Mar 2026 is 13.13% vs -5.07% in Mar 2025",
        "dir": 1
      },
      {
        "prefix": "Standalone Net Profit ",
        "suffix": "YoY Growth in year ended Mar 2026 is -25.20% vs -30.82% in Mar 2025",
        "dir": 1
      }
    ],
    "table": {
      "header": [
        "Mar'26",
        "Mar'25",
        "Change(%)"
      ],
      "body": [
        {
          "field": "Net Sales",
          "val1": "518.77",
          "val2": "458.57",
          "chgp": "13.13%",
          "chgp_class": "positive"
        },
        {
          "field": "Operating Profit (PBDIT) excl Other Income",
          "val1": "164.56",
          "val2": "147.19",
          "chgp": "11.80%",
          "chgp_class": "positive"
        },
        {
          "field": "Interest",
          "val1": "0.63",
          "val2": "0.73",
          "chgp": "-13.70%",
          "chgp_class": "positive"
        },
        {
          "field": "Exceptional Items",
          "val1": "-4.42",
          "val2": "0.00",
          "chgp": "",
          "chgp_class": "neutral"
        },
        {
          "field": "Standalone Net Profit",
          "val1": "81.73",
          "val2": "109.27",
          "chgp": "-25.20%",
          "chgp_class": "negative"
        },
        {
          "field": "Operating Profit Margin (Excl OI)",
          "val1": "31.72%",
          "val2": "32.10%",
          "chgp": "-0.38%",
          "chgp_class": "negative"
        }
      ]
    }
  }
]

Quarterly Results Snapshot (Standalone) - Jun'26 - YoYstock-summary

Jun'26
Jun'25
Change(%)
Net Sales
242.63
168.24
44.22%
Operating Profit (PBDIT) excl Other Income
112.52
76.68
46.74%
Interest
0.14
0.11
27.27%
Exceptional Items
0.00
0.00
Standalone Net Profit
72.80
52.57
38.48%
Operating Profit Margin (Excl OI)
46.38%
45.58%
0.80%
Values in Rs Cr.
Direction Arrows
Net Sales

YoY Growth in quarter ended Jun 2026 is 44.22% vs -2.70% in Jun 2025

Direction Arrows
Standalone Net Profit

YoY Growth in quarter ended Jun 2026 is 38.48% vs -16.87% in Jun 2025

Half Yearly Results Snapshot (Standalone) - Sep'25stock-summary

Sep'25
Sep'24
Change(%)
Net Sales
248.40
240.28
3.38%
Operating Profit (PBDIT) excl Other Income
84.17
90.29
-6.78%
Interest
0.23
0.35
-34.29%
Exceptional Items
0.00
0.00
Standalone Net Profit
50.83
77.96
-34.80%
Operating Profit Margin (Excl OI)
33.88%
37.58%
-3.70%
Values in Rs Cr.
Direction Arrows
Net Sales

Growth in half year ended Sep 2025 is 3.38% vs -7.51% in Sep 2024

Direction Arrows
Standalone Net Profit

Growth in half year ended Sep 2025 is -34.80% vs -20.45% in Sep 2024

Nine Monthly Results Snapshot (Standalone) - Dec'25stock-summary

Dec'25
Dec'24
Change(%)
Net Sales
382.93
361.79
5.84%
Operating Profit (PBDIT) excl Other Income
124.40
127.45
-2.39%
Interest
0.49
0.51
-3.92%
Exceptional Items
-8.05
0.00
Standalone Net Profit
65.31
98.26
-33.53%
Operating Profit Margin (Excl OI)
32.49%
35.23%
-2.74%
Values in Rs Cr.
Direction Arrows
Net Sales

YoY Growth in nine months ended Dec 2025 is 5.84% vs -5.63% in Dec 2024

Direction Arrows
Standalone Net Profit

YoY Growth in nine months ended Dec 2025 is -33.53% vs -27.41% in Dec 2024

Annual Results Snapshot (Standalone) - Mar'26stock-summary

Mar'26
Mar'25
Change(%)
Net Sales
518.77
458.57
13.13%
Operating Profit (PBDIT) excl Other Income
164.56
147.19
11.80%
Interest
0.63
0.73
-13.70%
Exceptional Items
-4.42
0.00
Standalone Net Profit
81.73
109.27
-25.20%
Operating Profit Margin (Excl OI)
31.72%
32.10%
-0.38%
Values in Rs Cr.
Direction Arrows
Net Sales

YoY Growth in year ended Mar 2026 is 13.13% vs -5.07% in Mar 2025

Direction Arrows
Standalone Net Profit

YoY Growth in year ended Mar 2026 is -25.20% vs -30.82% in Mar 2025

stock-summaryCompany CV
About Wonderla Holidays Ltd stock-summary
stock-summary
Wonderla Holidays Ltd
Small Cap
Leisure Services
Wonderla Holidays Limited was originally incorporated as a Private Limited Company in Bangalore on November 18, 2002 under the name and style of `Wonderla Holidays Private Limited'. The Amusement park in Kochi was set up as a Public Limited Company on February 3, 1998 under the name and style of `Veega Holidays and Parks Limited', which converted into a Private Limited Company on July 4, 2001 under the name and style of `Veega Holidays and Parks Private Limited'.
Company Coordinates stock-summary
Company Details
28th KM, Mysore Road Bangalore Karnataka : 562109
stock-summary
Tel: 91-80-22010333
stock-summary
investors@wonderla.com
Registrar Details
Karvy Computershare Pvt Ltd, Plot No 17-24 , Near Image Hospital,, Reliance Cybervilae,Vithalrao Nagar,, Madhapur, Hyderabad