
Compare Worldwide Alumi. with Similar Stocks
Dashboard
Weak Long Term Fundamental Strength with an average Return on Equity (ROE) of 1.55%
- Poor long term growth as Operating profit has grown by an annual rate 8.59% of over the last 5 years
- Company's ability to service its debt is weak with a poor EBIT to Interest (avg) ratio of -0.22
Flat results in Mar 26
Stock DNA
Trading & Distributors
INR 7 Cr (Micro Cap)
53.00
19
0.00%
-0.01
2.08%
1.16
Total Returns (Price + Dividend) 
Worldwide Alumi. for the last several years.
Risk Adjusted Returns v/s
Returns Beta

News
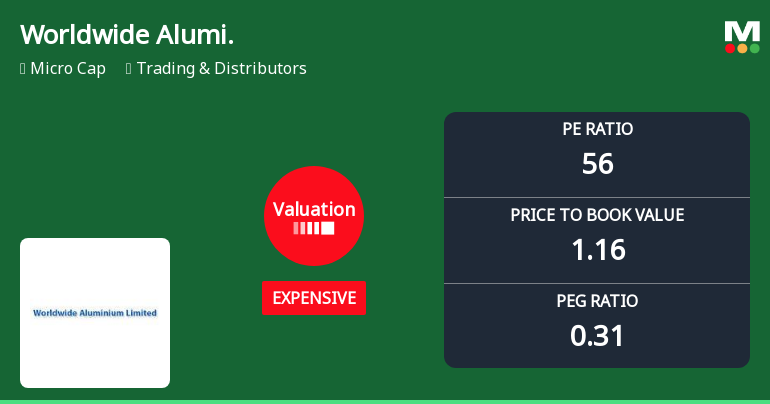
Worldwide Aluminium Ltd Valuation Shifts Signal Price Attractiveness Concerns
Worldwide Aluminium Ltd has experienced a notable shift in its valuation parameters, moving from a fair to an expensive rating, raising questions about its price attractiveness relative to historical and peer benchmarks. Despite recent gains in share price and strong long-term returns, the company’s elevated price-to-earnings ratio and subdued return on capital metrics suggest caution for investors navigating the Trading & Distributors sector.
Read full news article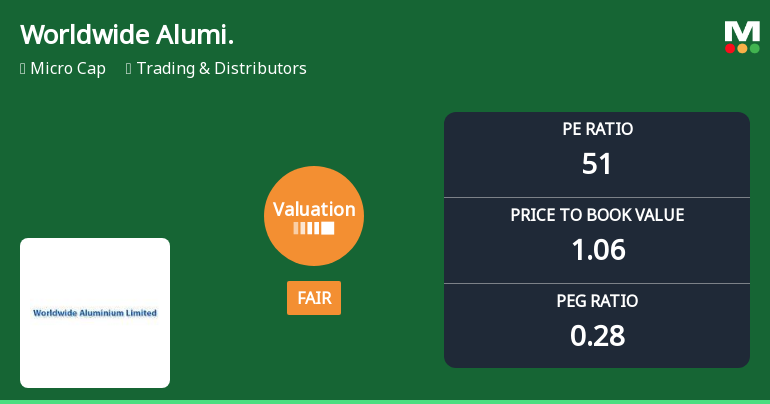
Worldwide Aluminium Ltd Valuation Shifts to Fair Amid Mixed Financial Signals
Worldwide Aluminium Ltd has seen a notable shift in its valuation parameters, moving from an expensive to a fair valuation grade, reflecting evolving market perceptions amid mixed financial performance. Despite a micro-cap status and a recent downgrade in its Mojo Grade to Sell, the company’s price-to-earnings (P/E) and price-to-book value (P/BV) ratios suggest a more balanced price attractiveness compared to its historical and peer averages.
Read full news article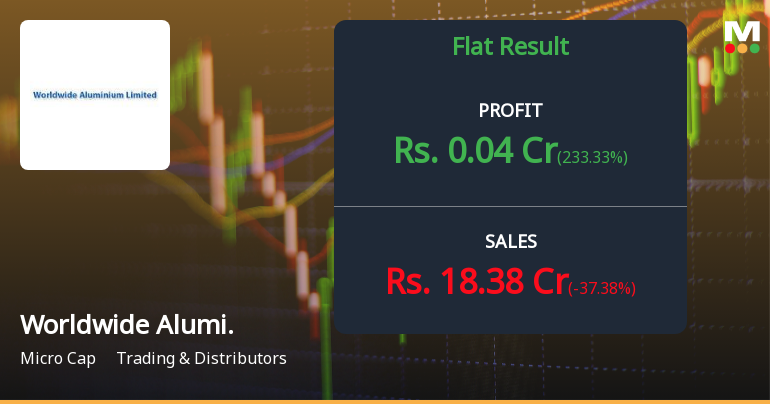
Worldwide Aluminium Q4 FY26: Marginal Profit Amidst Revenue Decline and Valuation Concerns
Worldwide Aluminium Ltd., a micro-cap trading and distribution company, reported a net profit of ₹0.04 crores for Q4 FY26 (March 2026 quarter), marking a modest turnaround from the ₹0.03 crore loss posted in the corresponding quarter last year. However, the quarter witnessed a sharp 37.38% year-on-year decline in net sales to ₹18.38 crores, raising concerns about demand momentum and operational sustainability. The stock closed at ₹19.95 on May 29, 2026, up 5.00% on the day, though it remains 24.66% below its 52-week high of ₹26.48.
Read full news article Announcements
Board Meeting Outcome for Outcome Of Board Meeting Held On May 29 2026 And Audited Standalone Financial Results Of The Company For The Quarter And Year Ended March 31 2026.
29-May-2026 | Source : BSE1. Audited Standalone Financial Results of the Company for the quarter and Year ended March 31 2026; 2. Independent Auditors Report issued by M/s Jain Kedia and Sharma Statutory Auditors of the Company on Audited Standalone Financial Results of the Company for the quarter and Year ended March 31 2026: 3. Statement Showing Assets and Liabilities and Cash Flow for the year ended 31st March 2026. 4. Declaration as per regulation 33(3)(d) of SEBI (LODR) Regulation 2015 The Meeting of the Board of Directors commenced at 06:00 P.M. and concluded at 10:15 P.M. You are requested to kindly intimate the members of the Stock Exchange and public at large accordingly.
Board Meeting Intimation for Intimation Of Board Meeting Pursuant To Regulations 29 Of The SEBI (LODR) Regulations 2015 To Be Held On May 29 2026
22-May-2026 | Source : BSEWorldwide Aluminium Ltdhas informed BSE that the meeting of the Board of Directors of the Company is scheduled on 29/05/2026 inter alia to consider and approve Dear Sir/Madam Pursuant to the provisions of Regulation 29 and other applicable provisions if any of the Securities and Exchange Board of India (Listing Obligations and Disclosure Requirements) Regulations 2015 we wish to inform you that a meeting of Board of Directors of the Company is scheduled to be held on Friday May 29 2026 inter-alia to consider approve and take on record the audited Financial Statements of the Company for the 4th quarter and year ended March 31st 2026.
Compliances-Certificate under Reg. 74 (5) of SEBI (DP) Regulations 2018
18-Apr-2026 | Source : BSEWe enclose herewith the confirmation certificate received from Beetal Financial and Computer Services Private Limited Registrar and Share Transfer Agent of the Company pursuant to Regulation 74 (5) of SEBI (Depositories and Participants) Regulation 2018 for the year ended March 31 2026.
Corporate Actions

No Upcoming Board Meetings

No Dividend history available

No Splits history available

No Bonus history available

No Rights history available
Quality key factors
Valuation key factors
Technicals key factors
 Technical Indicator Scale: Bearish, Mildly Bearish, Sideways, Mildly Bullish, Bullish Turned
 Shareholding Snapshot : Mar 2026
Shareholding Compare (%holding)
Promoters
None
Held by 0 Schemes
Held by 0 FIIs
Jainalco Industries Private Limited (30.28%)
Yogesh Kumar Gupta (5.74%)
41.2%
Quarterly Results Snapshot (Standalone) - Mar'26 - YoY

YoY Growth in quarter ended Mar 2026 is -37.38% vs 318.09% in Mar 2025

YoY Growth in quarter ended Mar 2026 is 233.33% vs -107.89% in Mar 2025
Half Yearly Results Snapshot (Standalone) - Sep'25
Growth in half year ended Sep 2025 is 142.83% vs 0.00% in Sep 2024
Growth in half year ended Sep 2025 is 350.00% vs 106.90% in Sep 2024
Nine Monthly Results Snapshot (Standalone) - Dec'25
YoY Growth in nine months ended Dec 2025 is 103.71% vs 0.00% in Dec 2024
YoY Growth in nine months ended Dec 2025 is 200.00% vs 108.11% in Dec 2024
Annual Results Snapshot (Standalone) - Mar'26
YoY Growth in year ended Mar 2026 is 31.16% vs 756.13% in Mar 2025
YoY Growth in year ended Mar 2026 is 0.00% vs 0.00% in Mar 2025
About Worldwide Aluminium Ltd

Company Coordinates


