
Compare Worth Investment with Similar Stocks
Stock DNA
Non Banking Financial Company (NBFC)
INR 161 Cr (Micro Cap)
46.00
21
0.00%
6.64
7.85%
3.58
Total Returns (Price + Dividend) 
Worth Investment for the last several years.
Risk Adjusted Returns v/s
Returns Beta

News
Worth Investment & Trading Company Ltd is Rated Sell
Worth Investment & Trading Company Ltd is rated 'Sell' by MarketsMOJO. This rating was last updated on 29 May 2026, reflecting a shift from a previous 'Strong Sell' stance. However, the analysis and financial metrics discussed here represent the stock's current position as of 15 June 2026, providing investors with an up-to-date view of its performance and outlook.
Read full news article
Worth Investment & Trading Company Ltd is Rated Sell
Worth Investment & Trading Company Ltd is rated 'Sell' by MarketsMOJO. This rating was last updated on 29 May 2026, reflecting a reassessment of the stock’s outlook. However, all fundamentals, returns, and financial metrics discussed here are current as of 01 June 2026, providing investors with the latest perspective on the company’s position.
Read full news article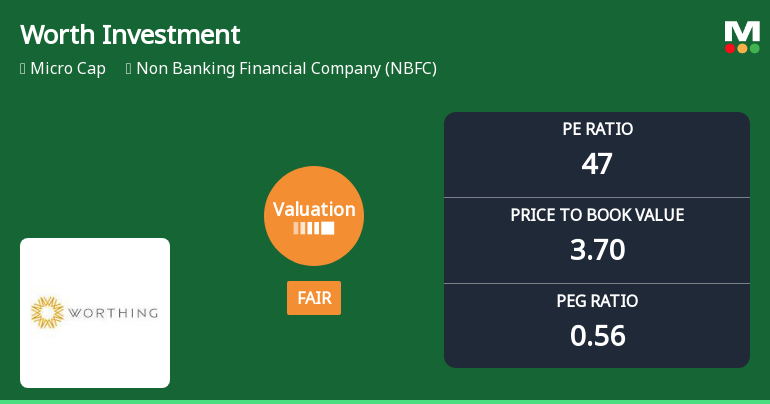
Worth Investment & Trading Company Ltd: Valuation Shifts Signal Changing Market Sentiment
Worth Investment & Trading Company Ltd, a micro-cap player in the Non Banking Financial Company (NBFC) sector, has seen a notable shift in its valuation parameters, moving from an expensive to a fair valuation grade. Despite a challenging recent price performance, the company’s price-to-earnings (P/E) and price-to-book value (P/BV) ratios suggest a recalibration of price attractiveness relative to its historical levels and peer group, warranting a closer examination for investors.
Read full news article Announcements
Announcement under Regulation 30 (LODR)-Newspaper Publication
29-May-2026 | Source : BSEIn terms of Regulation 47 of the SEBI (Lisiting Obligation and Disclosure Requirements) Regulations 2015 the Company has published an Extract of Statement of Audited Standalone Financial Results of the Company for the quarter and financial year ended on March 31 2026. The Said financial Results have been published in Active Times (English Newspaper) edition dated 29/05/2026 and Mumbai Lakshadweep (Marathi Newspaper) edition dated 29/05/2026
Compliances-Reg.24(A)-Annual Secretarial Compliance
29-May-2026 | Source : BSEPursuant to the provisions of Regulation 24 A SEBI (Listing Obligations and Disclosure Requirements) Regulations 2015 Please find enclosed herewith the Annual Secretarial Compliance Report of the Company for the financial year ended March 31 2026 issued by Mr. Parbat Chaudhari Practicing Company Secretaries
Board Meeting Intimation for Approving The Audited Financial Results For The Quarter Aand Year Ended March 31 2026
22-May-2026 | Source : BSEWorth Investment & Trading Co Ltdhas informed BSE that the meeting of the Board of Directors of the Company is scheduled on 27/05/2026 inter alia to consider and approve This is to inform you that the Meeting of Board of Directors of the Company is scheduled to be held on Wednesday May 27 2026 to consider and approve the following transactions: a. To consider and approve the Audited Financial Results along with the Auditors report thereon for the quarter and financial year ended on 31st March 2026; b. Any other business with the permission of the Chair. Further pursuant to SEBI (Prohibition of Insider Trading) Regulation 2015 as amended from time to time the trading window of the Company has been closed from April 01 2026 and shall remain closed till 48 hours from the announcement/declaration of the audited Financial Results.
Corporate Actions

No Upcoming Board Meetings

No Dividend history available

Worth Investment & Trading Company Ltd has announced 1:10 stock split, ex-date: 03 Jul 24

Worth Investment & Trading Company Ltd has announced 3:2 bonus issue, ex-date: 14 Nov 24

No Rights history available
Quality key factors
Valuation key factors
Technicals key factors
 Technical Indicator Scale: Bearish, Mildly Bearish, Sideways, Mildly Bullish, Bullish Turned
 Shareholding Snapshot : Mar 2026
Shareholding Compare (%holding)
Promoters
None
Held by 0 Schemes
Held by 0 FIIs
Bina Rajesh Ghatalia (9.04%)
Chetan Kirti Bhai Mehta (6.88%)
38.01%
Quarterly Results Snapshot (Standalone) - Dec'25 - QoQ

QoQ Growth in quarter ended Dec 2025 is 51.22% vs -0.81% in Sep 2025
QoQ Growth in quarter ended Dec 2025 is 35.59% vs -27.16% in Sep 2025
Half Yearly Results Snapshot (Standalone) - Sep'25

Growth in half year ended Sep 2025 is -4.28% vs 35.26% in Sep 2024
Growth in half year ended Sep 2025 is 0.00% vs 29.91% in Sep 2024
Nine Monthly Results Snapshot (Standalone) - Dec'25
YoY Growth in nine months ended Dec 2025 is 11.63% vs 29.87% in Dec 2024
YoY Growth in nine months ended Dec 2025 is 14.06% vs -20.99% in Dec 2024
Annual Results Snapshot (Standalone) - Mar'26
YoY Growth in year ended Mar 2026 is 145.70% vs 16.36% in Mar 2025
YoY Growth in year ended Mar 2026 is 84.21% vs 2.70% in Mar 2025
About Worth Investment & Trading Company Ltd

Company Coordinates


