
Compare Worth Peripheral with Similar Stocks
Total Returns (Price + Dividend) 
Latest dividend: 1 per share ex-dividend date: Sep-16-2025
Risk Adjusted Returns v/s
Returns Beta

News

Worth Peripherals Ltd is Rated Sell
Worth Peripherals Ltd is rated Sell by MarketsMOJO, with this rating last updated on 29 May 2026. However, the analysis and financial metrics discussed here reflect the company’s current position as of 23 June 2026, providing investors with the latest insights into the stock’s fundamentals, valuation, financial trends, and technical outlook.
Read full news article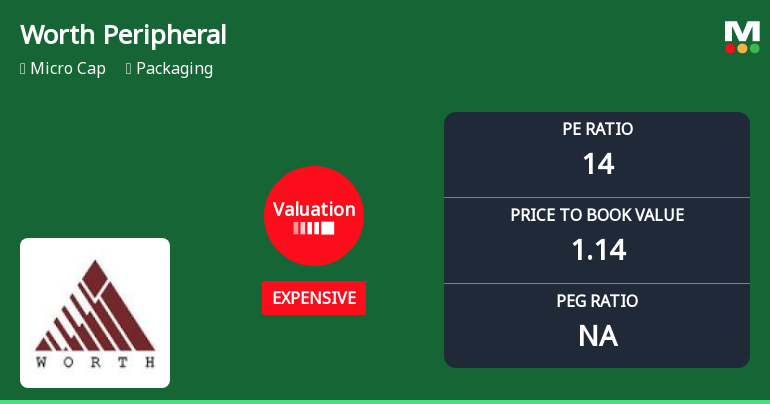
Worth Peripherals Ltd Valuation Shifts Signal Price Attractiveness Challenges
Worth Peripherals Ltd, a micro-cap player in the packaging sector, has seen its valuation parameters shift notably, with its price-to-earnings (P/E) and price-to-book value (P/BV) ratios moving from fair to expensive territory. This change, coupled with a recent downgrade in its Mojo Grade from Hold to Sell, signals a reassessment of the stock’s price attractiveness relative to its historical averages and peer group.
Read full news article
Worth Peripherals Ltd is Rated Sell
Worth Peripherals Ltd is rated 'Sell' by MarketsMOJO, with this rating last updated on 29 May 2026. However, the analysis and financial metrics discussed here reflect the stock's current position as of 12 June 2026, providing investors with an up-to-date view of the company’s performance and outlook.
Read full news article Announcements
Company Update About The Acquisition Of The Shares
22-May-2026 | Source : BSECompany Update about the Acquisition of the Shares.
Compliances-Reg.24(A)-Annual Secretarial Compliance
15-May-2026 | Source : BSEAnnual Secretarial Compliance Report for the Financial Year ended 31.03.2026
Announcement under Regulation 30 (LODR)-Newspaper Publication
14-May-2026 | Source : BSENewspaper Publication of the Q4 Financial Results for the F.Y. ended 31.03.2026
Corporate Actions

No Upcoming Board Meetings

Worth Peripherals Ltd has declared 10% dividend, ex-date: 16 Sep 25

No Splits history available

No Bonus history available

No Rights history available
Quality key factors
Valuation key factors
Technicals key factors
 Technical Indicator Scale: Bearish, Mildly Bearish, Sideways, Mildly Bullish, Bullish Turned
 Shareholding Snapshot : Mar 2026
Shareholding Compare (%holding)
Promoters
None
Held by 0 Schemes
Held by 0 FIIs
Raminder Singh Chadha (31.25%)
Vijit Global Securities Private Limited (5.04%)
21.91%
Quarterly Results Snapshot (Consolidated) - Mar'26 - YoY

YoY Growth in quarter ended Mar 2026 is 6.98% vs 19.98% in Mar 2025
YoY Growth in quarter ended Mar 2026 is -30.86% vs -24.16% in Mar 2025
Half Yearly Results Snapshot (Consolidated) - Sep'25
Growth in half year ended Sep 2025 is 12.53% vs 14.15% in Sep 2024

Growth in half year ended Sep 2025 is 26.18% vs 1.12% in Sep 2024
Nine Monthly Results Snapshot (Consolidated) - Dec'25
YoY Growth in nine months ended Dec 2025 is 11.80% vs 14.23% in Dec 2024
YoY Growth in nine months ended Dec 2025 is 7.09% vs 12.26% in Dec 2024
Annual Results Snapshot (Consolidated) - Mar'26
YoY Growth in year ended Mar 2026 is 10.56% vs 15.65% in Mar 2025
YoY Growth in year ended Mar 2026 is -5.18% vs -2.83% in Mar 2025
About Worth Peripherals Ltd

Company Coordinates


