
Compare WSFX Global with Similar Stocks
Stock DNA
Financial Technology (Fintech)
INR 79 Cr (Micro Cap)
13.00
21
2.40%
0.41
14.81%
1.89
Total Returns (Price + Dividend) 
Latest dividend: 1.4999999999999998 per share ex-dividend date: Sep-17-2025
Risk Adjusted Returns v/s
Returns Beta

News

WSFX Global Pay Ltd Downgraded to Sell Amid Technical Weakness and Mixed Fundamentals
WSFX Global Pay Ltd, a micro-cap player in the Financial Technology sector, has seen its investment rating downgraded from Hold to Sell as of 13 July 2026. The revision reflects a deterioration in technical indicators despite some positive financial trends, signalling caution for investors amid mixed performance metrics and valuation concerns.
Read full news article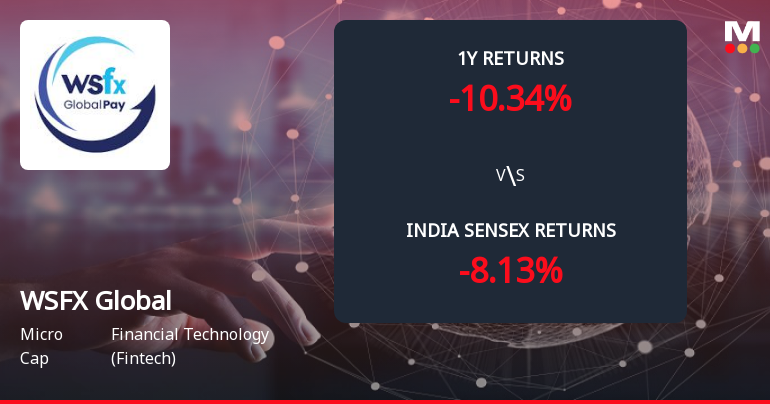
WSFX Global Pay Ltd Forms Death Cross, Signalling Potential Bearish Trend
WSFX Global Pay Ltd, a micro-cap player in the Financial Technology sector, has recently formed a Death Cross, a significant technical indicator where the 50-day moving average crosses below the 200-day moving average. This development signals a potential shift towards a bearish trend, reflecting a deterioration in the stock’s medium to long-term momentum and raising concerns about sustained weakness ahead.
Read full news article
WSFX Global Pay Ltd is Rated Hold by MarketsMOJO
WSFX Global Pay Ltd is rated 'Hold' by MarketsMOJO, with this rating last updated on 06 July 2026. However, the analysis and financial metrics discussed here reflect the stock's current position as of 07 July 2026, providing investors with an up-to-date perspective on the company’s performance and outlook.
Read full news article Announcements
Announcement Under Regulation 30 Of SEBI (LODR) Regulation 2015
17-Jul-2026 | Source : BSELaunch of Global Pay Connect- Strategic Forex Card Distribution Program
Intimation Under Regulation 30 Regarding Transfer Of Shares/Unclaimed Dividend To IEPF Authority.
11-Jul-2026 | Source : BSENotice to Shareholder for claiming unclaimed/ upaid Dividends
Announcement under Regulation 30 (LODR)-Newspaper Publication
11-Jul-2026 | Source : BSENewspaper Publication for Transfer of Shares of the Company to IEPF Authority.
Corporate Actions

No Upcoming Board Meetings

WSFX Global Pay Ltd has declared 15% dividend, ex-date: 17 Sep 25

No Splits history available

No Bonus history available

No Rights history available
Quality key factors
Valuation key factors
Technicals key factors
 Technical Indicator Scale: Bearish, Mildly Bearish, Sideways, Mildly Bullish, Bullish Turned
 Shareholding Snapshot : Jun 2026
Shareholding Compare (%holding)
Promoters
None
Held by 0 Schemes
Held by 0 FIIs
Spice Connect Private Limited (57.0%)
Stocktalks Private Limited (7.89%)
23.23%
Quarterly Results Snapshot (Standalone) - Mar'26 - QoQ

QoQ Growth in quarter ended Mar 2026 is -7.65% vs -18.91% in Dec 2025

QoQ Growth in quarter ended Mar 2026 is -68.57% vs -52.32% in Dec 2025
Half Yearly Results Snapshot (Standalone) - Sep'25
Growth in half year ended Sep 2025 is 19.65% vs 28.57% in Sep 2024
Growth in half year ended Sep 2025 is -8.37% vs 63.92% in Sep 2024
Nine Monthly Results Snapshot (Standalone) - Dec'25
YoY Growth in nine months ended Dec 2025 is 26.35% vs 24.66% in Dec 2024
YoY Growth in nine months ended Dec 2025 is 4.49% vs 71.15% in Dec 2024
Annual Results Snapshot (Standalone) - Mar'26
YoY Growth in year ended Mar 2026 is 24.76% vs 23.53% in Mar 2025
YoY Growth in year ended Mar 2026 is 76.95% vs -15.78% in Mar 2025
About WSFX Global Pay Ltd

Company Coordinates


