
Compare Wynn Resorts Ltd. with Similar Stocks
Dashboard
With a Negative Book Value, the company has a Weak Long Term Fundamental Strength
- Poor long term growth as Net Sales has grown by an annual rate of 9.94% and Operating profit at 40.33% over the last 5 years
- High Debt Company with a Debt to Equity ratio (avg) at times
- The company has been able to generate a Return on Capital Employed (avg) of 5.51% signifying low profitability per unit of total capital (equity and debt)
Risky - Negative Book Value
Stock DNA
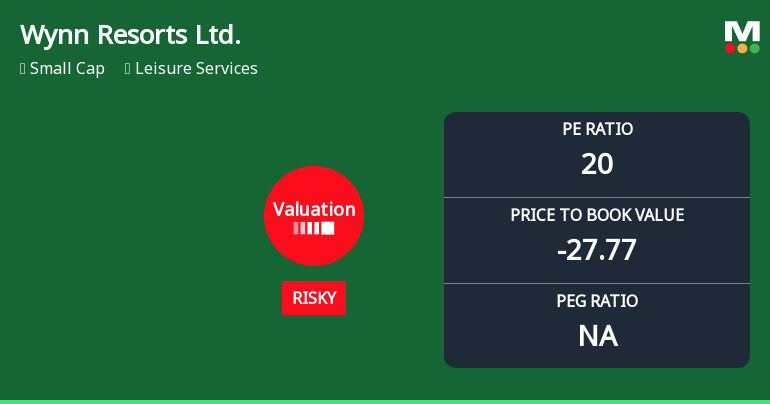
Leisure Services
USD 11,867 Million (Small Cap)
20.00
NA
96.01%
-23.26
-161.41%
-32.07
Total Returns (Price + Dividend) 
Wynn Resorts Ltd. for the last several years.
Risk Adjusted Returns v/s
News
Wynn Resorts Ltd. Experiences Revision in Its Stock Evaluation Amid Strong Performance
Wynn Resorts Ltd. has recently adjusted its valuation, with its stock price reflecting a significant increase. Over the past year, the company has outperformed the S&P 500, achieving a return of 44.71%. Key financial metrics reveal a mixed valuation landscape compared to peers in the leisure services industry.
Read full news article Announcements

Corporate Actions
Quality key factors
Valuation key factors
Technicals key factors
 Technical Indicator Scale: Bearish, Mildly Bearish, Sideways, Mildly Bullish, Bullish Turned
 Shareholding Snapshot : Sep 2025
Shareholding Compare (%holding)
Domestic Funds
Held in 98 Schemes (33.5%)
Held by 267 Foreign Institutions (11.74%)
Quarterly Results Snapshot (Consolidated) - Sep'25 - YoY

YoY Growth in quarter ended Sep 2025 is 8.29% vs 1.28% in Sep 2024
YoY Growth in quarter ended Sep 2025 is 2,477.78% vs 95.52% in Sep 2024
Annual Results Snapshot (Consolidated) - Dec'24

YoY Growth in year ended Dec 2024 is 9.13% vs 73.87% in Dec 2023
YoY Growth in year ended Dec 2024 is -18.22% vs 210.26% in Dec 2023
About Wynn Resorts Ltd.

Company Coordinates


