
Compare Xelpmoc Design with Similar Stocks
Dashboard
With a Operating Losses, the company has a Weak Long Term Fundamental Strength
- Poor long term growth as Net Sales has grown by an annual rate of -23.26% and Operating profit at -221.56% over the last 5 years
- Company's ability to service its debt is weak with a poor EBIT to Interest (avg) ratio of -12.64
Flat results in Mar 26
Risky - Negative EBITDA
Consistent Underperformance against the benchmark over the last 3 years
Stock DNA
Software Products
INR 119 Cr (Micro Cap)
NA (Loss Making)
32
0.00%
-0.08
-9.77%
1.58
Total Returns (Price + Dividend) 
Xelpmoc Design for the last several years.
Risk Adjusted Returns v/s
Returns Beta

News
Xelpmoc Design and Tech Ltd is Rated Strong Sell
Xelpmoc Design and Tech Ltd is rated Strong Sell by MarketsMOJO, with this rating last updated on 20 April 2026. However, the analysis and financial metrics discussed below reflect the company’s current position as of 30 July 2026, providing investors with the latest insights into its performance and outlook.
Read full news article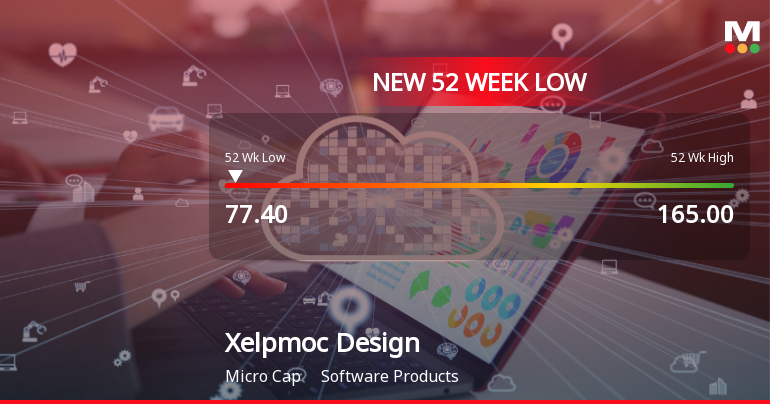
Xelpmoc Design and Tech Ltd Falls to 52-Week Low of Rs 77.4 as Sell-Off Deepens
For the fifth consecutive session, Xelpmoc Design and Tech Ltd closed lower, breaching its 52-week low at Rs 77.4 on 24 Jul 2026, marking a significant decline from its 52-week high of Rs 165. This persistent downtrend has intensified despite some contrasting financial signals.
Read full news article
Xelpmoc Design and Tech Ltd is Rated Strong Sell
Xelpmoc Design and Tech Ltd is rated Strong Sell by MarketsMOJO. This rating was last updated on 20 Apr 2026. However, the analysis and financial metrics discussed below reflect the stock’s current position as of 19 July 2026, providing investors with the latest insights into the company’s performance and outlook.
Read full news article Announcements
Announcement under Regulation 30 (LODR)-Allotment of ESOP / ESPS
27-Jul-2026 | Source : BSEAllotment of Equity Shares pursuant to Employees Stock Option Scheme 2019.
Compliances-Certificate under Reg. 74 (5) of SEBI (DP) Regulations 2018
20-Jul-2026 | Source : BSECertificate under Regulation 74(5) of SEBI (DP) Regulations 2018
Closure of Trading Window
29-Jun-2026 | Source : BSEClosure of Trading Window
Corporate Actions

No Upcoming Board Meetings

No Dividend history available

No Splits history available

No Bonus history available

No Rights history available
Quality key factors
Valuation key factors
Technicals key factors
 Technical Indicator Scale: Bearish, Mildly Bearish, Sideways, Mildly Bullish, Bullish Turned
 Shareholding Snapshot : Jun 2026
Shareholding Compare (%holding)
Non Institution
None
Held by 0 Schemes
Held by 1 FIIs (0.07%)
Sandipan Chattopadhyay (27.56%)
Omprakash Kanayalal Shah (5.3%)
45.19%
Quarterly Results Snapshot (Consolidated) - Mar'26 - QoQ

QoQ Growth in quarter ended Mar 2026 is -3.57% vs 47.37% in Dec 2025

QoQ Growth in quarter ended Mar 2026 is 11.00% vs -3.63% in Dec 2025
Half Yearly Results Snapshot (Consolidated) - Sep'25
Growth in half year ended Sep 2025 is -34.75% vs -46.61% in Sep 2024
Growth in half year ended Sep 2025 is 25.00% vs 37.21% in Sep 2024
Nine Monthly Results Snapshot (Consolidated) - Dec'25
YoY Growth in nine months ended Dec 2025 is -16.61% vs -42.52% in Dec 2024
YoY Growth in nine months ended Dec 2025 is 18.63% vs 4.16% in Dec 2024
Annual Results Snapshot (Consolidated) - Mar'26
YoY Growth in year ended Mar 2026 is -4.10% vs -39.72% in Mar 2025
YoY Growth in year ended Mar 2026 is 6.06% vs 39.11% in Mar 2025
About Xelpmoc Design and Tech Ltd

Company Coordinates


