
Compare Xelpmoc Design with Similar Stocks
Dashboard
With a Operating Losses, the company has a Weak Long Term Fundamental Strength
- Poor long term growth as Net Sales has grown by an annual rate of -23.26% and Operating profit at -221.56% over the last 5 years
- Company's ability to service its debt is weak with a poor EBIT to Interest (avg) ratio of -12.64
Flat results in Mar 26
Risky - Negative EBITDA
Consistent Underperformance against the benchmark over the last 3 years
Stock DNA
Software Products
INR 129 Cr (Micro Cap)
NA (Loss Making)
33
0.00%
-0.08
-9.77%
1.67
Total Returns (Price + Dividend) 
Xelpmoc Design for the last several years.
Risk Adjusted Returns v/s
Returns Beta

News
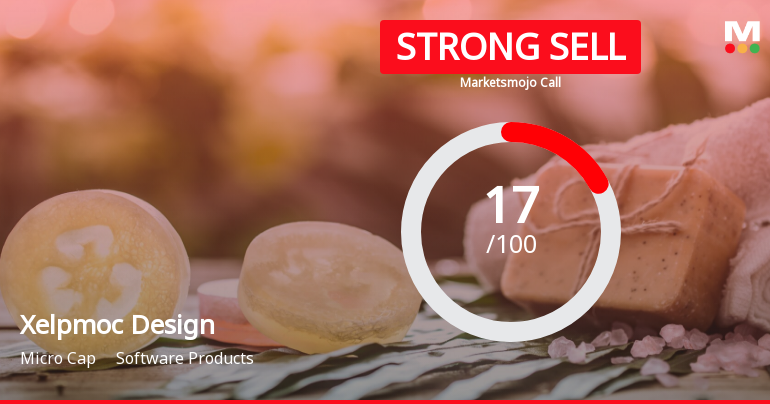
Xelpmoc Design and Tech Ltd is Rated Strong Sell
Xelpmoc Design and Tech Ltd is rated Strong Sell by MarketsMOJO. This rating was last updated on 20 April 2026, reflecting a shift from the previous 'Sell' grade. However, the analysis and financial metrics presented here are based on the company's current position as of 08 July 2026, providing investors with the latest insights into the stock's performance and outlook.
Read full news article
Xelpmoc Design and Tech Ltd is Rated Strong Sell
Xelpmoc Design and Tech Ltd is rated Strong Sell by MarketsMOJO. This rating was last updated on 20 April 2026, reflecting a significant reassessment of the stock’s outlook. However, the analysis and financial metrics presented here are based on the company’s current position as of 27 June 2026, providing investors with the latest insights into its performance and prospects.
Read full news article
Xelpmoc Design and Tech Ltd is Rated Strong Sell
Xelpmoc Design and Tech Ltd is rated Strong Sell by MarketsMOJO. This rating was last updated on 20 April 2026, reflecting a shift from the previous 'Sell' grade. However, the analysis and financial metrics discussed here represent the stock's current position as of 16 June 2026, providing investors with the latest insights into the company’s performance and outlook.
Read full news article Announcements
Xelpmoc Design And Tech Limited - Other General Purpose
03-Dec-2019 | Source : NSEXelpmoc Design And Tech Limited has informed the Exchange regarding a copy of disclosure of Related Party Transactions for the half year ended September 30, 2019 pursuant to Regulation 23(9) of the Listing Regulations.
Xelpmoc Design And Tech Limited - Outcome of Board Meeting
08-Nov-2019 | Source : NSEXelpmoc Design And Tech Limited has informed the Exchange regarding Board meeting held on November 07, 2019.Please find attached herewith scanned copy of outcome of the Board Meeting held today.
Xelpmoc Design And Tech Limited - Analysts/Institutional Investor Meet/Con. Call Updates
05-Nov-2019 | Source : NSEXelpmoc Design And Tech Limited has informed the Exchange regarding Analysts/Institutional Investor Meet/Con. Call Updates Pursuant to Regulation 30 (6) of the Securities and Exchange Board of India (Listing Obligations and Disclosure Requirements) Regulations, 2015 (the 'Listing Regulations') read with Part A of Schedule III of the Regulation, we would like to inform that the Company has Scheduled an Earnings Call with the Investors and Shareholders to discuss operational and financial performance in 2nd quarter and half year ended September 30, 2019 on Friday, November 08, 2019 at 5.30 P.M.
Corporate Actions

No Upcoming Board Meetings

No Dividend history available

No Splits history available

No Bonus history available

No Rights history available
Quality key factors
Valuation key factors
Technicals key factors
 Technical Indicator Scale: Bearish, Mildly Bearish, Sideways, Mildly Bullish, Bullish Turned
 Shareholding Snapshot : Mar 2026
Shareholding Compare (%holding)
Non Institution
None
Held by 0 Schemes
Held by 1 FIIs (0.06%)
Sandipan Chattopadhyay (27.64%)
Omprakash Kanayalal Shah (5.18%)
45.05%
Quarterly Results Snapshot (Consolidated) - Mar'26 - QoQ

QoQ Growth in quarter ended Mar 2026 is -3.57% vs 47.37% in Dec 2025

QoQ Growth in quarter ended Mar 2026 is 11.00% vs -3.63% in Dec 2025
Half Yearly Results Snapshot (Consolidated) - Sep'25
Growth in half year ended Sep 2025 is -34.75% vs -46.61% in Sep 2024
Growth in half year ended Sep 2025 is 25.00% vs 37.21% in Sep 2024
Nine Monthly Results Snapshot (Consolidated) - Dec'25
YoY Growth in nine months ended Dec 2025 is -16.61% vs -42.52% in Dec 2024
YoY Growth in nine months ended Dec 2025 is 18.63% vs 4.16% in Dec 2024
Annual Results Snapshot (Consolidated) - Mar'26
YoY Growth in year ended Mar 2026 is -4.10% vs -39.72% in Mar 2025
YoY Growth in year ended Mar 2026 is 6.06% vs 39.11% in Mar 2025
About Xelpmoc Design and Tech Ltd

Company Coordinates


