
Compare Yamaichi Electronics Co., Ltd. with Similar Stocks
Dashboard
High Management Efficiency with a high ROE of 14.08%
Company's ability to service its debt is strong with a healthy EBIT to Interest (avg) ratio of 55.33
Healthy long term growth as Net Sales has grown by an annual rate of 10.90%
Positive results in Jun 25
With ROE of 13.84%, it has a very attractive valuation with a 1.38 Price to Book Value
Stock DNA
Electronics & Appliances
JPY 136,436 Million (Small Cap)
10.00
NA
0.00%
-0.32
14.21%
3.29
Total Returns (Price + Dividend) 
Yamaichi Electronics Co., Ltd. for the last several years.
Risk Adjusted Returns v/s
News
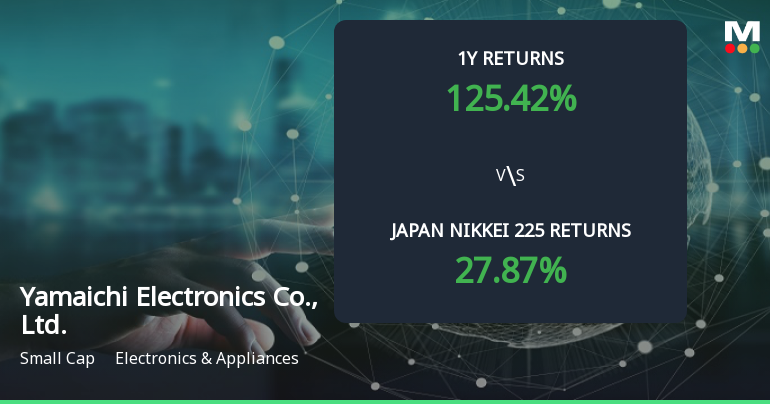
Yamaichi Electronics Achieves 125.42% Return, Establishing It as a Multibagger in Japan's Market
Yamaichi Electronics Co., Ltd. has recently undergone a revision in its score, reflecting its strong market position and impressive performance metrics. The company has achieved significant returns over various time frames, including a remarkable annual growth rate and robust financial health indicators, reinforcing its status in the Electronics & Appliances sector.
Read full news article Announcements

Corporate Actions
Quality key factors
Valuation key factors
Technicals key factors
 Technical Indicator Scale: Bearish, Mildly Bearish, Sideways, Mildly Bullish, Bullish Turned
 Shareholding Snapshot
Shareholding Compare (%holding)
Quarterly Results Snapshot (Consolidated) - Sep'25 - QoQ

QoQ Growth in quarter ended Sep 2025 is -17.49% vs 59.90% in Jun 2025
QoQ Growth in quarter ended Sep 2025 is -33.04% vs 286.10% in Jun 2025
Annual Results Snapshot (Consolidated) - Mar'25

YoY Growth in year ended Mar 2025 is 24.37% vs -22.48% in Mar 2024
YoY Growth in year ended Mar 2025 is 146.70% vs -70.67% in Mar 2024
About Yamaichi Electronics Co., Ltd.

Company Coordinates


