Yash Chemex

  • Market Cap: Micro Cap
  • Industry: Miscellaneous
  • ISIN: INE571U01010
  • NSEID:
  • BSEID: 539939
INR
51.00
0.99 (1.98%)
BSENSE

Sep 23, 03:30 PM

BSE+NSE Vol: 5.58 k

  • Price Points
  • Score
  • Mojo Parameters
  • Total Return
  • News and Corporate Actions
  • Key factors
  • Shareholding
  • Financials
  • CompanyCV
stock-summaryPrice Point
High/Low

1Day

52 Week

Valuation
Technical
Day's Volume

CASH

5.58 k (134.50%) Volume

Shareholding (Jun 2026)

FII

0.00%

Held by 0 FIIs

DII

0.00%

Held by 0 DIIs

Promoter

64.61%

Why is Yash Chemex Ltd falling/rising?

06-Sep-2026

As of 05-Sep, Yash Chemex Ltd's stock price is rising at 50.30, with a 0.76% increase today and a 5.74% gain over the last two days. However, it has significant long-term declines of over 36% year-to-date and declining investor participation, which may pose challenges ahead.

As of 05-Sep, Yash Chemex Ltd's stock price is rising, currently at 50.30, reflecting a change of 0.38 (0.76%) upwards. The stock has outperformed its sector by 0.49% today and has shown a consecutive gain over the last two days, with a total increase of 5.74% during this period. Additionally, the stock's performance over the past week indicates a positive trend, with a return of +2.40%, while the benchmark Sensex has declined by -0.97%. <BR><BR>Despite these positive indicators, it is important to note that the stock has experienced significant declines over longer periods, with a year-to-date drop of -36.05% and a one-year decline of -41.07%. The stock is currently trading above its 5-day, 20-day, and 50-day moving averages, although it remains below its 100-day and 200-day moving averages. <BR><BR>However, there is a concerning trend in investor participation, as the delivery volume has decreased by -39.28% compared to the 5-day average, indicating a potential decrease in trading interest. Overall, while Yash Chemex Ltd is experiencing a short-term rise in stock price, the long-term performance and declining investor participation may pose challenges moving forward.

View full answer

Who are in the management team of Yash Chemex?

01-Sep-2026

The management team of Yash Chemex includes Pritesh Shah (Managing Director), Yashwant Lal Shah (Chairman), Dimple P Shah (Director), and three Independent Directors: Jinal Shah, Angee Shah, and Rushabh Shah, along with Riddhi Shah as Company Secretary. Their roles are vital for the company's governance and strategic direction.

The management team of Yash Chemex includes the following individuals:<BR><BR>1. **Pritesh Shah Yeshwant Bhai** - Managing Director, with a remuneration of INR 22.0 lacs.<BR>2. **Yashwant Lal Chhanalal Shah** - Chairman & Wholetime Director, earning INR 8.5 lacs.<BR>3. **Dimple P Shah** - Director, with a remuneration of INR 15.0 lacs.<BR>4. **Jinal Dineshbhai Shah** - Independent Director, earning INR 20.0 k.<BR>5. **Angee Rajendrakumar Shah** - Independent Director, with a remuneration of INR 25.0 k.<BR>6. **Rushabh Shah** - Independent Director, earning INR 30.0 k.<BR>7. **Riddhi Shah** - Company Secretary & Compliance Officer, with no remuneration listed.<BR><BR>This team plays a crucial role in the governance and strategic direction of the company.

View full answer

What does Yash Chemex do?

01-Sep-2026

Yash Chemex Ltd is a micro-cap company in the miscellaneous industry, incorporated in 2006 and public since 2016, with recent quarterly net sales of 17 Cr and net profit of 1 Cr. Key financial metrics include a market cap of INR 51 Cr, P/E of 23.00, and a debt-equity ratio of 0.28.

Overview: <BR>Yash Chemex Ltd operates in the miscellaneous industry as a micro-cap company.<BR><BR>History: <BR>The company was initially incorporated in 2006 as "Yash Chemtex Pvt. Ltd" and later converted into a public limited company in 2016. The most recent quarterly results reported net sales and net profit for June 2026.<BR><BR>Financial Snapshot: <BR>Net Sales: 17 Cr (Quarterly Results - Jun 2026) <BR>Net Profit: 1 Cr (Quarterly Results - Jun 2026) <BR>Market Cap: INR 51 Cr (Micro Cap)<BR><BR>Key Metrics: <BR>P/E: 23.00 <BR>Industry P/E: 43 <BR>Dividend Yield: 0.00% <BR>Debt-Equity: 0.28 <BR>Return on Equity: 4.92% <BR>Price to Book: 1.22 <BR><BR>Contact Details: <BR>Address: 411 Sigma Icon - 1 132 Ft, Ring Road Satellite Ahmedabad Gujarat : 380015 <BR>Tel: 91-79-26730257/58 <BR>Fax: 91-79-26730258 <BR>Email: aesha@yashchemex.com <BR>Website: http://www.yashchemex.com

View full answer

Who are the peers of the Yash Chemex?

01-Sep-2026

Yash Chemex's peers include Anmol India, Divyashakti, and Ravi Leela Gran, among others. Yash Chemex has below average management and growth risks, with a 1-year return of -32.67%, better than Anmol India's -37.83% but worse than Ravi Leela Gran's 42.07%.

Peers: The peers of Yash Chemex are Anmol India, Divyashakti, Ravi Leela Gran, Inland Printers, Pulz Electronics, Graphisads, Priti Internati., Pentagon Rubber, and Supreme Facility.<BR><BR>Quality Snapshot: Good management risk is observed at Anmol India and Pulz Electronics, while Average management risk is found at Priti Internati., Pentagon Rubber, and the rest. Below Average management risk is noted for Divyashakti, Ravi Leela Gran, Yash Chemex, Graphisads, Supreme Facility, and Mittal Life Styl. Excellent growth is seen at Pulz Electronics, while Average growth is noted for Ravi Leela Gran and the rest. Below Average growth is present at Anmol India, Divyashakti, Yash Chemex, Graphisads, Supreme Facility, and Mittal Life Styl. Good capital structure is found at Divyashakti and Priti Internati., while Below Average capital structure is observed at Anmol India, Ravi Leela Gran, Yash Chemex, Graphisads, Pentagon Rubber, Supreme Facility, and Mittal Life Styl.<BR><BR>Return Snapshot: The peer with the highest 1-year return is Ravi Leela Gran at 42.07%, while the peer with the lowest is Anmol India at -37.83%. Yash Chemex's 1-year return of -32.67% is better than Anmol India's but worse than Ravi Leela Gran's. Additionally, Inland Printers has a negative six-month return of -37.85%.

View full answer

How big is Yash Chemex?

01-Sep-2026

As of 31st August, Yash Chemex Ltd has a market capitalization of 51.00 Cr, with recent Net Sales of 131.10 Cr and a Net Profit of 2.20 Cr. Shareholder's Funds are 37.65 Cr and Total Assets amount to 85.06 Cr as of March 2025.

As of 31st August, Yash Chemex Ltd has a market capitalization of 51.00 Cr, categorizing it as a Micro Cap company.<BR><BR>In the latest four quarters, Yash Chemex reported Net Sales of 131.10 Cr and a Net Profit of 2.20 Cr.<BR><BR>The latest annual period for the balance sheet is March 2025, with Shareholder's Funds amounting to 37.65 Cr and Total Assets of 85.06 Cr.

View full answer

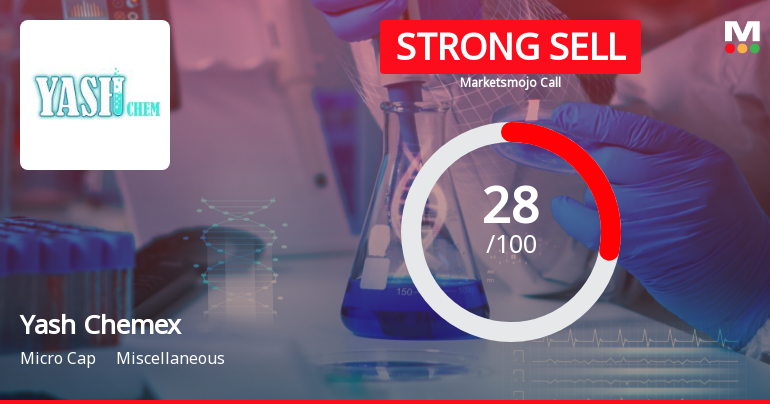
Should I buy, sell or hold Yash Chemex Ltd?

16-Aug-2026

Are Yash Chemex Ltd latest results good or bad?

02-Jun-2026

Yash Chemex Ltd's latest results show record net sales growth of 36.84%, but the company reported an operating loss of ₹1.49 crores and a consolidated net loss of ₹0.10 crores, indicating significant operational challenges and suggesting the results are more bad than good.

Yash Chemex Ltd's latest results indicate a challenging situation for the company. While net sales reached a record high of ₹40.97 crores, reflecting a strong year-on-year growth of 36.84% and a sequential growth of 19.45%, the company faced significant operational difficulties. <BR><BR>The operating profit (excluding other income) resulted in a loss of ₹1.49 crores, leading to an operating margin of -3.64%, which is the lowest performance recorded in the past eight quarters. Additionally, the consolidated net profit was a loss of ₹0.10 crores, marking a drastic decline of 150% year-on-year.<BR><BR>This performance highlights a concerning disconnect between revenue growth and profitability. Despite the impressive sales figures, the company's inability to manage costs effectively has overshadowed this growth, raising fundamental questions about its operational efficiency. <BR><BR>Overall, while the revenue growth is a positive aspect, the operational losses and deteriorating profitability suggest that the results are more bad than good, indicating serious challenges that need to be addressed.

View full answer

When is the next results date for Yash Chemex Ltd?

05-Feb-2026

The next results date for Yash Chemex Ltd is 14 February 2026.

The next results date for Yash Chemex Ltd is scheduled for 14 February 2026.

View full answer

Is Yash Chemex overvalued or undervalued?

03-Nov-2025

As of October 31, 2025, Yash Chemex is considered overvalued with a high PE ratio of 61.11 and EV to EBIT ratio of 99.53, despite a low Price to Book Value of 0.27, indicating a premium compared to peers like Godrej Industries and Solar Industries, while its strong stock performance of 105.84% year-to-date suggests market sentiment may be inflating its price beyond fundamental values.

As of 31 October 2025, Yash Chemex's valuation grade has moved from very attractive to attractive, indicating a shift in its perceived value. The company is currently considered overvalued based on its high PE ratio of 61.11 and EV to EBIT ratio of 99.53, which are significantly above industry norms. In contrast, its Price to Book Value stands at a low 0.27, suggesting some underlying asset value that is not fully reflected in its market price.<BR><BR>When compared to peers, Yash Chemex's valuation metrics are notably higher; for instance, Solar Industries has a PE of 99.81 and an EV to EBITDA of 61.42, while Godrej Industries, which is also rated attractive, has a much lower PE of 36.92 and an EV to EBITDA of 29.41. This disparity highlights that Yash Chemex may be trading at a premium relative to its peers. Additionally, the company's strong stock performance, with a year-to-date return of 105.84% compared to the Sensex's 7.42%, further complicates its valuation narrative, suggesting that market sentiment may be driving its price beyond fundamental values.

View full answer

How has been the historical performance of Yash Chemex?

16-Oct-2025

Yash Chemex's historical performance shows a recovery in profitability, with net sales increasing to 95.28 Cr in Mar'25 and profit after tax rising to 2.84 Cr, following a loss in the previous year. Total assets also grew to 85.06 Cr, indicating positive trends in both financial health and shareholder equity.

Answer:<BR>The historical performance of Yash Chemex shows a fluctuating trend in key financial metrics over the years. <BR><BR>Breakdown:<BR>Yash Chemex's net sales increased slightly from 94.91 Cr in Mar'24 to 95.28 Cr in Mar'25, following a rise from 85.33 Cr in Mar'23. However, net sales were lower than the peak of 97.84 Cr in Mar'22 and 98.96 Cr in Mar'19. The total operating income mirrored this trend, reaching 95.28 Cr in Mar'25. The raw material cost saw a significant decrease from 31.99 Cr in Mar'24 to 13.47 Cr in Mar'25, while the purchase of finished goods rose from 62.24 Cr to 79.27 Cr in the same period. Operating profit (PBDIT) improved to 5.53 Cr in Mar'25 from 1.59 Cr in Mar'24, indicating a recovery after a loss in the previous year. Profit before tax also rebounded to 3.88 Cr in Mar'25, compared to a loss of 0.07 Cr in Mar'24. Consequently, profit after tax rose to 2.84 Cr in Mar'25 from 0.33 Cr in Mar'24. The consolidated net profit showed a similar recovery, increasing to 2.05 Cr in Mar'25 from a loss of 0.27 Cr in Mar'24. Total assets rose to 85.06 Cr in Mar'25 from 77.26 Cr in Mar'24, while total liabilities also increased to 85.06 Cr from 77.26 Cr. The book value per share improved to 36.75 in Mar'25 from 34.70 in Mar'24, reflecting a positive trend in shareholder equity. Overall, Yash Chemex demonstrated a recovery in profitability and asset growth in the latest fiscal year.

View full answer

Who are the top shareholders of the Yash Chemex?

17-Jul-2025

The top shareholders of Yash Chemex include Pritesh Yashwantlal Shah with 24.92%, individual investors holding 31.62%, and Navinbhai Gordhanbhai Patel as the highest public shareholder at 1.39%. There are no mutual funds or foreign institutional investors in the company.

The top shareholders of Yash Chemex include the promoters, with Pritesh Yashwantlal Shah holding the largest share at 24.92%. The majority of the company's shares are held by individual investors, who collectively own 31.62%. Additionally, the highest public shareholder is Navinbhai Gordhanbhai Patel, with a holding of 1.39%. There are no mutual funds or foreign institutional investors currently holding shares in the company.

View full answer

What is the technical trend for Yash Chemex?

09-Jun-2025

As of June 5, 2025, Yash Chemex shows a mildly bearish technical trend, with mixed signals from MACD and Bollinger Bands across different time frames, while daily moving averages indicate short-term weakness.

As of 5 June 2025, the technical trend for Yash Chemex has changed from bearish to mildly bearish. The weekly MACD indicates a mildly bullish stance, while the monthly MACD remains bearish. The daily moving averages are mildly bearish, suggesting short-term weakness. The Bollinger Bands show a bullish signal on the weekly chart but are mildly bearish on the monthly chart, indicating mixed signals across time frames. The KST is mildly bullish weekly but bearish monthly, further contributing to the overall mildly bearish outlook. The Dow Theory shows no trend in both weekly and monthly perspectives. Overall, the current technical stance is mildly bearish, driven primarily by the daily moving averages and the mixed signals from the MACD and Bollinger Bands.

View full answer

What is the bonus history of the Yash Chemex?

06-Jun-2025

Yash Chemex issued a 3:2 bonus on March 14, 2018, with a record date of March 15, 2018, allowing eligible shareholders to receive additional shares in that ratio.

Yash Chemex has a bonus history that includes a 3:2 bonus issue announced on March 14, 2018. The record date for this bonus was March 15, 2018. This means that shareholders on record as of that date were eligible to receive additional shares in the specified ratio.

View full answer

Has Yash Chemex declared dividend?

06-Jun-2025

Yash Chemex Ltd has declared a 3% dividend, amounting to 0.3 per share, with an ex-date of February 26, 2019. However, the company has shown negative total returns across various periods, with no dividend contributions to returns in recent years.

Yash Chemex Ltd has declared a 3% dividend.<BR><BR>Dividend Details:<BR>- Percentage announced: 3%<BR>- Amount per share: 0.3<BR>- Ex-date: 26 Feb 19<BR><BR>Dividend Yield: 0%<BR><BR>Total Returns by Period:<BR>In the 6-month period, the price return was -5.09%, the dividend return was 0%, resulting in a total return of -5.09%.<BR><BR>For the 1-year period, the price return was -6.4%, the dividend return was 0%, leading to a total return of -6.4%.<BR><BR>Over the 2-year period, the price return was -39.65%, with a dividend return of 0%, culminating in a total return of -39.65%.<BR><BR>In the 3-year period, the price return was -8.28%, the dividend return was 0%, resulting in a total return of -8.28%.<BR><BR>For the 4-year period, the price return was 2.88%, with a dividend return of 0%, leading to a total return of 2.88%.<BR><BR>In the 5-year period, the price return was -37.27%, the dividend return was 0%, resulting in a total return of -37.27%.<BR><BR>Overall, Yash Chemex has declared a dividend, but the total returns over various periods indicate a generally negative performance, with no dividends contributing to the returns in recent years.

View full answer
iScoreScore

Dashboard

1

Weak Long Term Fundamental Strength with a -42.39% CAGR growth in Operating Profits over the last 5 years

  • Company's ability to service its debt is weak with a poor EBIT to Interest (avg) ratio of 1.13
  • The company has been able to generate a Return on Equity (avg) of 6.36% signifying low profitability per unit of shareholders funds
2

Flat results in Jun 26

3

Below par performance in long term as well as near term

stock-summaryMojo Parameters

Mojo Parameters

Loading Valuation Snapshot...

Stock DNA

stock-summary
Industry

Miscellaneous

stock-summary
Market cap

INR 51 Cr (Micro Cap)

stock-summary
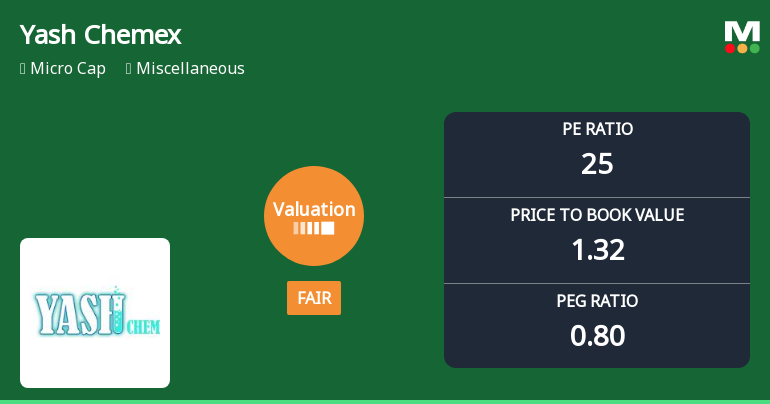
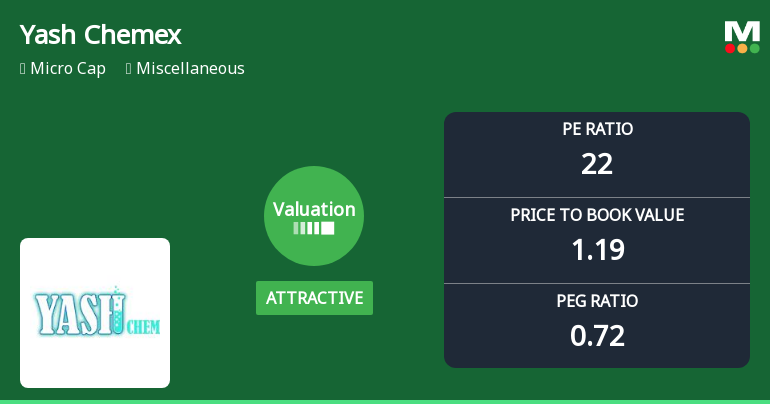
P/E

24.00

stock-summary
Industry P/E

42

stock-summary
Dividend Yield

0.00%

stock-summary
Debt Equity

0.28

stock-summary
Return on Equity

4.92%

stock-summary
Price to Book

1.25

Revenue and Profits:
Net Sales:
17 Cr
(Quarterly Results - Jun 2026)
Net Profit:
1 Cr
stock-summaryTotal Returns
Total Returns (Price + Dividend) stock-summary
Dividend Yield (0%)
TimePeriod
Price Return
Dividend Return
Total Return
3 Months
-0.58%
0%
-0.58%
6 Months
-8.65%
0%
-8.65%
1 Year
-43.3%
0%
-43.3%
2 Years
-3.9%
0%
-3.9%
3 Years
-26.16%
0%
-26.16%
4 Years
4.4%
0%
4.4%
5 Years
34.56%
0%
34.56%

Latest dividend: 0.3 per share ex-dividend date: Feb-26-2019

Risk Adjusted Returns v/s stock-summary
Returns Beta
Icon
Beta has not been calculated since enough price history is not available
stock-summaryNews & Corporate Actions

Announcements stock-summary

Disclosures under Reg. 29(2) of SEBI (SAST) Regulations 2011

11-Sep-2026 | Source : BSE

The Exchange has received the disclosure under Regulation 29(2) of SEBI (Substantial Acquisition of Shares & Takeovers) Regulations 2011 for Paxal Shah & PACs

Disclosures under Reg. 29(2) of SEBI (SAST) Regulations 2011

09-Sep-2026 | Source : BSE

The Exchange has received the disclosure under Regulation 29(2) of SEBI (Substantial Acquisition of Shares & Takeovers) Regulations 2011 for Paxal Shah & PACs

Announcement under Regulation 30 (LODR)-Newspaper Publication

04-Sep-2026 | Source : BSE

Copies of Newspaper Publication dated 04/09/2026.

Corporate Actions stock-summary

stock-summary
BOARD MEETING

No Upcoming Board Meetings

stock-summary
DIVIDEND

Yash Chemex Ltd has declared 3% dividend, ex-date: 26 Feb 19

stock-summary
SPLITS

No Splits history available

stock-summary
BONUS

Yash Chemex Ltd has announced 3:2 bonus issue, ex-date: 14 Mar 18

stock-summary
RIGHTS

No Rights history available

stock-summaryKey Factors

Quality key factors stock-summary

Factor
Value
Sales Growth (5y)
12.86%
EBIT Growth (5y)
-42.39%
EBIT to Interest (avg)
1.13
Debt to EBITDA (avg)
2.98
Net Debt to Equity (avg)
0.28
Sales to Capital Employed (avg)
2.30
Tax Ratio
24.29%
Dividend Payout Ratio
0
Pledged Shares
0
Institutional Holding
0
ROCE (avg)
5.02%
ROE (avg)
6.36%

Valuation key factors

Factor
Value
P/E Ratio
24
Industry P/E
42
Price to Book Value
1.27
EV to EBIT
63.88
EV to EBITDA
63.88
EV to Capital Employed
1.21
EV to Sales
0.49
PEG Ratio
0.77
Dividend Yield
NA
ROCE (Latest)
2.15%
ROE (Latest)
4.92%

Technicals key factors

Indicator
Weekly
Monthly
MACD
Mildly Bullish
Bearish
RSI
No Signal
No Signal
Bollinger Bands
Sideways
Mildly Bearish
Moving Averages
Mildly Bearish (Daily)
KST
Mildly Bullish
Mildly Bearish
Dow Theory
Mildly Bullish
Mildly Bearish
stock-summary Technical Indicator Scale: Bearish, Mildly Bearish, Sideways, Mildly Bullish, Bullish  Turned 
stock-summaryShareholding
Shareholding Snapshot : Jun 2026stock-summary
Shareholding Compare (%holding) stock-summary
Majority shareholders

Promoters

Pledged Promoter Holdings

None

Mutual Funds

Held by 0 Schemes

FIIs

Held by 0 FIIs

Promoter with highest holding

Pritesh Yashwantlal Shah (24.92%)

Highest Public shareholder

Navinbhai Gordhanbhai Patel (2.2%)

Individual Investors Holdings

30.85%

stock-summaryFinancial
[
  {
    "link": "quarterly",
    "btn_text": "All Quarterly Results",
    "header": "Quarterly Results Snapshot (Consolidated) - Jun'26 - YoY",
    "rhs": [
      {
        "prefix": "Net Sales ",
        "suffix": "YoY Growth in quarter ended Jun 2026 is -42.92% vs 122.30% in Jun 2025",
        "dir": -1
      },
      {
        "prefix": "Consolidated Net Profit ",
        "suffix": "YoY Growth in quarter ended Jun 2026 is 30.51% vs -38.54% in Jun 2025",
        "dir": 1
      }
    ],
    "table": {
      "header": [
        "Jun'26",
        "Jun'25",
        "Change(%)"
      ],
      "body": [
        {
          "field": "Net Sales",
          "val1": "17.18",
          "val2": "30.10",
          "chgp": "-42.92%",
          "chgp_class": "negative"
        },
        {
          "field": "Operating Profit (PBDIT) excl Other Income",
          "val1": "0.28",
          "val2": "1.20",
          "chgp": "-76.67%",
          "chgp_class": "negative"
        },
        {
          "field": "Interest",
          "val1": "0.35",
          "val2": "0.39",
          "chgp": "-10.26%",
          "chgp_class": "positive"
        },
        {
          "field": "Exceptional Items",
          "val1": "0.00",
          "val2": "0.00",
          "chgp": "",
          "chgp_class": "neutral"
        },
        {
          "field": "Consolidate Net Profit",
          "val1": "0.77",
          "val2": "0.59",
          "chgp": "30.51%",
          "chgp_class": "positive"
        },
        {
          "field": "Operating Profit Margin (Excl OI)",
          "val1": "1.63%",
          "val2": "3.99%",
          "chgp": "-2.36%",
          "chgp_class": "negative"
        }
      ]
    }
  },
  {
    "link": "half-yearly",
    "btn_text": "All Half Yearly Results",
    "header": "Half Yearly Results Snapshot (Consolidated) - Sep'25",
    "rhs": [
      {
        "prefix": "Net Sales ",
        "suffix": " Growth in half year ended Sep 2025 is 80.87% vs -25.51% in Sep 2024",
        "dir": 1
      },
      {
        "prefix": "Consolidated Net Profit ",
        "suffix": " Growth in half year ended Sep 2025 is -18.47% vs -12.78% in Sep 2024",
        "dir": -1
      }
    ],
    "table": {
      "header": [
        "Sep'25",
        "Sep'24",
        "Change(%)"
      ],
      "body": [
        {
          "field": "Net Sales",
          "val1": "68.75",
          "val2": "38.01",
          "chgp": "80.87%",
          "chgp_class": "positive"
        },
        {
          "field": "Operating Profit (PBDIT) excl Other Income",
          "val1": "2.43",
          "val2": "3.42",
          "chgp": "-28.95%",
          "chgp_class": "negative"
        },
        {
          "field": "Interest",
          "val1": "0.71",
          "val2": "0.79",
          "chgp": "-10.13%",
          "chgp_class": "positive"
        },
        {
          "field": "Exceptional Items",
          "val1": "0.00",
          "val2": "0.00",
          "chgp": "",
          "chgp_class": "neutral"
        },
        {
          "field": "Consolidate Net Profit",
          "val1": "1.28",
          "val2": "1.57",
          "chgp": "-18.47%",
          "chgp_class": "negative"
        },
        {
          "field": "Operating Profit Margin (Excl OI)",
          "val1": "3.53%",
          "val2": "9.00%",
          "chgp": "-5.47%",
          "chgp_class": "negative"
        }
      ]
    }
  },
  {
    "link": "nine-monthly",
    "btn_text": "All Nine Monthly Results",
    "header": "Nine Monthly Results Snapshot (Consolidated) - Dec'25",
    "rhs": [
      {
        "prefix": "Net Sales ",
        "suffix": "YoY Growth in nine months ended Dec 2025 is 57.71% vs -6.58% in Dec 2024",
        "dir": 1
      },
      {
        "prefix": "Consolidated Net Profit ",
        "suffix": "YoY Growth in nine months ended Dec 2025 is 14.59% vs -15.53% in Dec 2024",
        "dir": 1
      }
    ],
    "table": {
      "header": [
        "Dec'25",
        "Dec'24",
        "Change(%)"
      ],
      "body": [
        {
          "field": "Net Sales",
          "val1": "103.05",
          "val2": "65.34",
          "chgp": "57.71%",
          "chgp_class": "positive"
        },
        {
          "field": "Operating Profit (PBDIT) excl Other Income",
          "val1": "2.70",
          "val2": "3.38",
          "chgp": "-20.12%",
          "chgp_class": "negative"
        },
        {
          "field": "Interest",
          "val1": "1.05",
          "val2": "1.23",
          "chgp": "-14.63%",
          "chgp_class": "positive"
        },
        {
          "field": "Exceptional Items",
          "val1": "0.00",
          "val2": "0.00",
          "chgp": "",
          "chgp_class": "neutral"
        },
        {
          "field": "Consolidate Net Profit",
          "val1": "2.12",
          "val2": "1.85",
          "chgp": "14.59%",
          "chgp_class": "positive"
        },
        {
          "field": "Operating Profit Margin (Excl OI)",
          "val1": "2.62%",
          "val2": "5.17%",
          "chgp": "-2.55%",
          "chgp_class": "negative"
        }
      ]
    }
  },
  {
    "link": "annual",
    "btn_text": "All Annual Results",
    "header": "Annual Results Snapshot (Consolidated) - Mar'26",
    "rhs": [
      {
        "prefix": "Net Sales ",
        "suffix": "YoY Growth in year ended Mar 2026 is 51.15% vs 0.39% in Mar 2025",
        "dir": 1
      },
      {
        "prefix": "Consolidated Net Profit ",
        "suffix": "YoY Growth in year ended Mar 2026 is -1.46% vs 859.26% in Mar 2025",
        "dir": -1
      }
    ],
    "table": {
      "header": [
        "Mar'26",
        "Mar'25",
        "Change(%)"
      ],
      "body": [
        {
          "field": "Net Sales",
          "val1": "144.02",
          "val2": "95.28",
          "chgp": "51.15%",
          "chgp_class": "positive"
        },
        {
          "field": "Operating Profit (PBDIT) excl Other Income",
          "val1": "1.22",
          "val2": "3.29",
          "chgp": "-62.92%",
          "chgp_class": "negative"
        },
        {
          "field": "Interest",
          "val1": "1.38",
          "val2": "1.56",
          "chgp": "-11.54%",
          "chgp_class": "positive"
        },
        {
          "field": "Exceptional Items",
          "val1": "0.00",
          "val2": "0.00",
          "chgp": "",
          "chgp_class": "neutral"
        },
        {
          "field": "Consolidate Net Profit",
          "val1": "2.02",
          "val2": "2.05",
          "chgp": "-1.46%",
          "chgp_class": "negative"
        },
        {
          "field": "Operating Profit Margin (Excl OI)",
          "val1": "0.85%",
          "val2": "3.45%",
          "chgp": "-2.60%",
          "chgp_class": "negative"
        }
      ]
    }
  }
]

Quarterly Results Snapshot (Consolidated) - Jun'26 - YoYstock-summary

Jun'26
Jun'25
Change(%)
Net Sales
17.18
30.10
-42.92%
Operating Profit (PBDIT) excl Other Income
0.28
1.20
-76.67%
Interest
0.35
0.39
-10.26%
Exceptional Items
0.00
0.00
Consolidate Net Profit
0.77
0.59
30.51%
Operating Profit Margin (Excl OI)
1.63%
3.99%
-2.36%
Values in Rs Cr.
Direction Arrows
Net Sales

YoY Growth in quarter ended Jun 2026 is -42.92% vs 122.30% in Jun 2025

Direction Arrows
Consolidated Net Profit

YoY Growth in quarter ended Jun 2026 is 30.51% vs -38.54% in Jun 2025

Half Yearly Results Snapshot (Consolidated) - Sep'25stock-summary

Sep'25
Sep'24
Change(%)
Net Sales
68.75
38.01
80.87%
Operating Profit (PBDIT) excl Other Income
2.43
3.42
-28.95%
Interest
0.71
0.79
-10.13%
Exceptional Items
0.00
0.00
Consolidate Net Profit
1.28
1.57
-18.47%
Operating Profit Margin (Excl OI)
3.53%
9.00%
-5.47%
Values in Rs Cr.
Direction Arrows
Net Sales

Growth in half year ended Sep 2025 is 80.87% vs -25.51% in Sep 2024

Direction Arrows
Consolidated Net Profit

Growth in half year ended Sep 2025 is -18.47% vs -12.78% in Sep 2024

Nine Monthly Results Snapshot (Consolidated) - Dec'25stock-summary

Dec'25
Dec'24
Change(%)
Net Sales
103.05
65.34
57.71%
Operating Profit (PBDIT) excl Other Income
2.70
3.38
-20.12%
Interest
1.05
1.23
-14.63%
Exceptional Items
0.00
0.00
Consolidate Net Profit
2.12
1.85
14.59%
Operating Profit Margin (Excl OI)
2.62%
5.17%
-2.55%
Values in Rs Cr.
Direction Arrows
Net Sales

YoY Growth in nine months ended Dec 2025 is 57.71% vs -6.58% in Dec 2024

Direction Arrows
Consolidated Net Profit

YoY Growth in nine months ended Dec 2025 is 14.59% vs -15.53% in Dec 2024

Annual Results Snapshot (Consolidated) - Mar'26stock-summary

Mar'26
Mar'25
Change(%)
Net Sales
144.02
95.28
51.15%
Operating Profit (PBDIT) excl Other Income
1.22
3.29
-62.92%
Interest
1.38
1.56
-11.54%
Exceptional Items
0.00
0.00
Consolidate Net Profit
2.02
2.05
-1.46%
Operating Profit Margin (Excl OI)
0.85%
3.45%
-2.60%
Values in Rs Cr.
Direction Arrows
Net Sales

YoY Growth in year ended Mar 2026 is 51.15% vs 0.39% in Mar 2025

Direction Arrows
Consolidated Net Profit

YoY Growth in year ended Mar 2026 is -1.46% vs 859.26% in Mar 2025

stock-summaryCompany CV
About Yash Chemex Ltd stock-summary
stock-summary
Yash Chemex Ltd
Micro Cap
Miscellaneous
Yash Chemtex Limited was Initially incorporated on June 3, 2006 as "Yash Chemtex Pvt. Ltd". The Company converted into a Public Limited Company and the name of the Company was changed to Yash Chemtex Limited vide fresh Certificate of Incorporation issued by the RoC on February 15, 2016.
Company Coordinates stock-summary
Company Details
411 Sigma Icon - 1 132 Ft, Ring Road Satellite Ahmedabad Gujarat : 380015
stock-summary
Tel: 91-79-26730257/58
stock-summary
aesha@yashchemex.com
Registrar Details
Bigshare Services Pvt Ltd , E-2 , Ansa Industrial Estate, Saki Vihar Road, Saki Naka, Andheri (E), Mumbai
Footer loading