
Compare Yash Innoventure with Similar Stocks
Dashboard
Weak Long Term Fundamental Strength with an average Return on Capital Employed (ROCE) of 0%
- Poor long term growth as Operating profit has grown by an annual rate -181.52% of over the last 5 years
- Company's ability to service its debt is weak with a poor EBIT to Interest (avg) ratio of -0.88
Flat results in Mar 26
Risky - Negative EBITDA
Reducing Promoter Confidence
Below par performance in long term as well as near term
Stock DNA
Diversified Commercial Services
INR 47 Cr (Micro Cap)
NA (Loss Making)
35
0.00%
1.41
-26.69%
3.31
Total Returns (Price + Dividend) 
Yash Innoventure for the last several years.
Risk Adjusted Returns v/s
Returns Beta

News
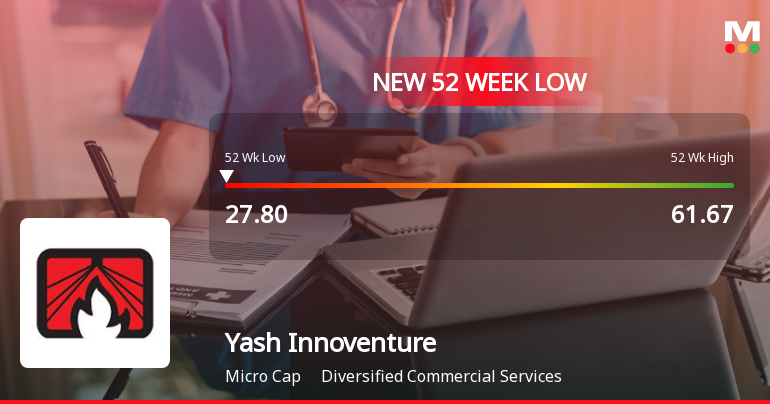
Yash Innoventures Ltd Falls to 52-Week Low of Rs 27.8 as Sell-Off Deepens
For the eighth consecutive session, Yash Innoventures Ltd has closed lower, culminating in a fresh 52-week low of Rs 27.8 on 23 Jun 2026. This marks a steep decline of 40.86% over this losing streak, underscoring persistent selling pressure despite a broadly stable market backdrop.
Read full news article

Yash Innoventures Ltd Downgraded to Strong Sell Amid Technical and Fundamental Weaknesses
Yash Innoventures Ltd, a micro-cap player in the diversified commercial services sector, has been downgraded from a Sell to a Strong Sell rating as of 15 Jun 2026. This revision reflects deteriorating technical indicators, stagnant financial performance, weak valuation metrics, and declining promoter confidence, signalling heightened risk for investors.
Read full news article Announcements
Clarification sought from Yash Innoventures Ltd
19-Jun-2026 | Source : BSEThe Exchange has sought clarification from Yash Innoventures Ltd on June 19 2026 with reference to significant movement in price in order to ensure that investors have latest relevant information about the company and to inform the market so that the interest of the investors is safeguarded.
The reply is awaited.
Disclosures under Reg. 29(2) of SEBI (SAST) Regulations 2011
16-Jun-2026 | Source : BSEThe Exchange has received the disclosure under Regulation 29(2) of SEBI (Substantial Acquisition of Shares & Takeovers) Regulations 2011 for Gnanesh Bhagat & PACs
Board Meeting Outcome for Outcome Of Board Meeting
13-Jun-2026 | Source : BSEOutcome of Board Meeting
Corporate Actions

No Upcoming Board Meetings

No Dividend history available

No Splits history available

No Bonus history available

No Rights history available
Quality key factors
Valuation key factors
Technicals key factors
 Technical Indicator Scale: Bearish, Mildly Bearish, Sideways, Mildly Bullish, Bullish Turned
 Shareholding Snapshot : Mar 2026
Shareholding Compare (%holding)
Promoters
None
Held by 0 Schemes
Held by 0 FIIs
Gnanesh Rajendrabhai Bhagat (59.38%)
Enam Securities Pvt Ltd (1.15%)
26.65%
Quarterly Results Snapshot (Standalone) - Mar'26 - QoQ

QoQ Growth in quarter ended Mar 2026 is 0.00% vs -100.00% in Dec 2025

QoQ Growth in quarter ended Mar 2026 is -91.11% vs 79.17% in Dec 2025
Half Yearly Results Snapshot (Standalone) - Sep'25
Growth in half year ended Sep 2025 is 181.63% vs -82.18% in Sep 2024
Growth in half year ended Sep 2025 is 368.70% vs -210.58% in Sep 2024
Nine Monthly Results Snapshot (Standalone) - Dec'25
YoY Growth in nine months ended Dec 2025 is 411.11% vs -90.18% in Dec 2024
YoY Growth in nine months ended Dec 2025 is 238.22% vs -335.80% in Dec 2024
Annual Results Snapshot (Standalone) - Mar'26
YoY Growth in year ended Mar 2026 is 411.11% vs -90.18% in Mar 2025
YoY Growth in year ended Mar 2026 is 139.69% vs -686.84% in Mar 2025
About Yash Innoventures Ltd

Company Coordinates


