
Compare Yash Mgmt & Sat. with Similar Stocks
Dashboard
Weak Long Term Fundamental Strength with an average Return on Equity (ROE) of 0.21%
- Poor long term growth as Operating profit has grown by an annual rate of -3.15%
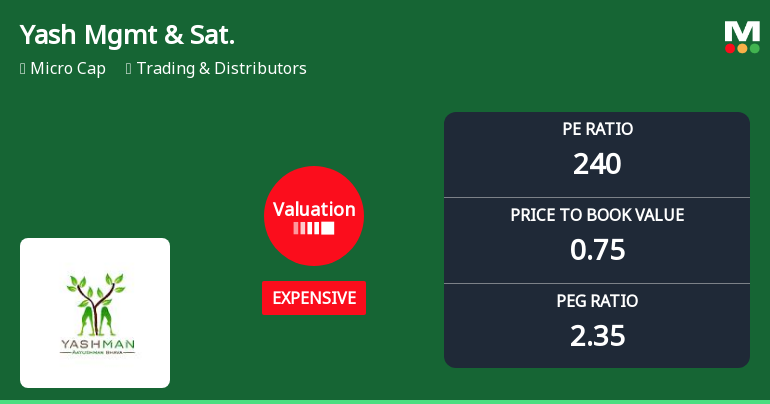
With ROE of 0.3, it has a Expensive valuation with a 0.7 Price to Book Value
Consistent Underperformance against the benchmark over the last 3 years
Stock DNA
Trading & Distributors
INR 17 Cr (Micro Cap)
237.00
21
0.00%
0.12
0.31%
0.75
Total Returns (Price + Dividend) 
Yash Mgmt & Sat. for the last several years.
Risk Adjusted Returns v/s
Returns Beta

News
Yash Management & Satelite Ltd Valuation Shifts Signal Price Attractiveness Change
Yash Management & Satelite Ltd, a micro-cap player in the Trading & Distributors sector, has experienced a notable shift in its valuation parameters, moving from a very expensive to an expensive rating. Despite a modest year-to-date return of 6.2%, the stock’s elevated price-to-earnings (P/E) ratio and subdued price-to-book value (P/BV) raise questions about its price attractiveness relative to peers and historical benchmarks.
Read full news article
Yash Management & Satelite Ltd Upgraded to Sell on Technical Improvements Despite Valuation Concerns
Yash Management & Satelite Ltd has seen its investment rating upgraded from Strong Sell to Sell, reflecting a nuanced shift in its technical outlook amid persistent valuation and fundamental challenges. The revision, effective from 22 June 2026, is driven primarily by improved technical indicators, while valuation metrics and financial trends continue to weigh on the stock’s appeal.
Read full news article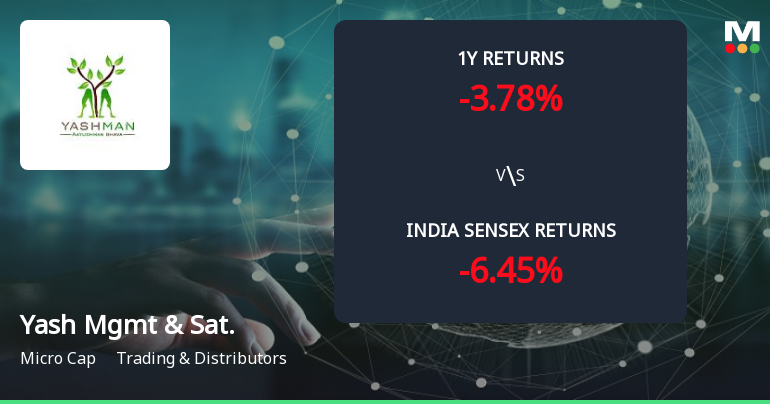
Golden Cross Forms in Yash Management & Satelite Ltd — On a Day the Stock Gained 1.8%. What the Mixed Signals Mean
The 50-day moving average has crossed above the 200-day moving average for Yash Management & Satelite Ltd, signalling a golden cross on 22 Jun 2026. However, the stock’s 1.80% gain on the day contrasts with some mixed technical indicators, suggesting the signal warrants a nuanced interpretation rather than straightforward optimism.
Read full news article Announcements
Announcement under Regulation 30 (LODR)-Newspaper Publication
04-Jun-2026 | Source : BSENewspaper Advertisement for the Notice of 33rd AGM
The Notice Of 33Rd Annual General Meeting Of The Company
03-Jun-2026 | Source : BSEThe Notice of 33rd Annual General Meeting of the company for the financial year 2025-2026 is scheduled to be held on 01.07.2026 through VC.
Reg. 34 (1) Annual Report.
03-Jun-2026 | Source : BSETHE ANNUAL REPORT FOR THE FINANCIAL YEAR 2025-2026
Corporate Actions

No Upcoming Board Meetings

No Dividend history available

No Splits history available

No Bonus history available

No Rights history available
Quality key factors
Valuation key factors
Technicals key factors
 Technical Indicator Scale: Bearish, Mildly Bearish, Sideways, Mildly Bullish, Bullish Turned
 Shareholding Snapshot : Mar 2026
Shareholding Compare (%holding)
Promoters
None
Held by 0 Schemes
Held by 0 FIIs
Anurag Hargovind Gupta (22.35%)
Golechha Global Finance Limited (2.35%)
32.92%
Quarterly Results Snapshot (Consolidated) - Mar'26 - QoQ

QoQ Growth in quarter ended Mar 2026 is 54.30% vs 120.69% in Dec 2025
QoQ Growth in quarter ended Mar 2026 is 104.17% vs 128.24% in Dec 2025
Half Yearly Results Snapshot (Consolidated) - Sep'25
Growth in half year ended Sep 2025 is -60.56% vs 87.59% in Sep 2024
Growth in half year ended Sep 2025 is 42.11% vs 57.78% in Sep 2024
Nine Monthly Results Snapshot (Consolidated) - Dec'25
YoY Growth in nine months ended Dec 2025 is -44.63% vs 57.13% in Dec 2024

YoY Growth in nine months ended Dec 2025 is 86.88% vs -42.86% in Dec 2024
Annual Results Snapshot (Consolidated) - Mar'26
YoY Growth in year ended Mar 2026 is -7.90% vs -27.51% in Mar 2025
YoY Growth in year ended Mar 2026 is 103.55% vs -264.81% in Mar 2025
About Yash Management & Satelite Ltd

Company Coordinates


