
Compare Yashraj Contain. with Similar Stocks
Dashboard
With a Negative Book Value, the company has a Weak Long Term Fundamental Strength
- Poor long term growth as Net Sales has grown by an annual rate of -100.00% and Operating profit at 0% over the last 5 years
- The company has a negative book value of Rs 109.24 crore
Flat results in Mar 26
Risky - Negative EBITDA
Consistent Underperformance against the benchmark over the last 3 years
Total Returns (Price + Dividend) 
Yashraj Contain. for the last several years.
Risk Adjusted Returns v/s
Returns Beta

News
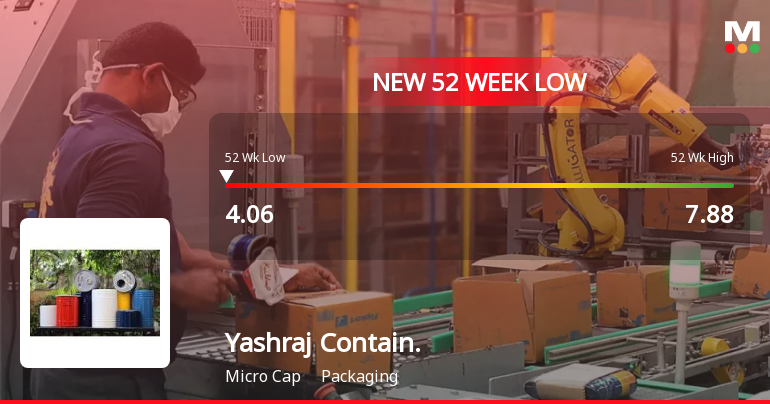
Markets Rally, But Yashraj Containeurs Ltd Sinks to 52-Week Low in Stock-Specific Sell-Off
Despite broader market gains, Yashraj Containeurs Ltd has plunged to a fresh 52-week low of Rs 4.06 on 8 Jul 2026, extending its recent losing streak and underperforming its sector and benchmark indices significantly.
Read full news articleAre Yashraj Containeurs Ltd latest results good or bad?
Yashraj Containeurs Ltd's latest financial results indicate a challenging operational environment. For the quarter ending March 2026, the company reported net sales of ₹0.00 crores, marking a continuation of zero revenue generation since June 2024. This lack of sales reflects a complete operational shutdown, which has persisted for seven consecutive quarters. The company recorded a net loss of ₹0.07 crores for Q4 FY26, which shows a reduction from the previous quarter's loss of ₹0.15 crores, suggesting some minor progress in loss containment. However, the operating profit before depreciation, interest, and tax (PBDIT) remained negative at ₹0.20 crores, indicating ongoing operational challenges. The minimal employee costs of ₹0.01 crores suggest that the company is operating with a skeletal workforce. Yashraj Containeurs has faced significant financial distress, evidenced by a negative book value of ₹108....
Read full news article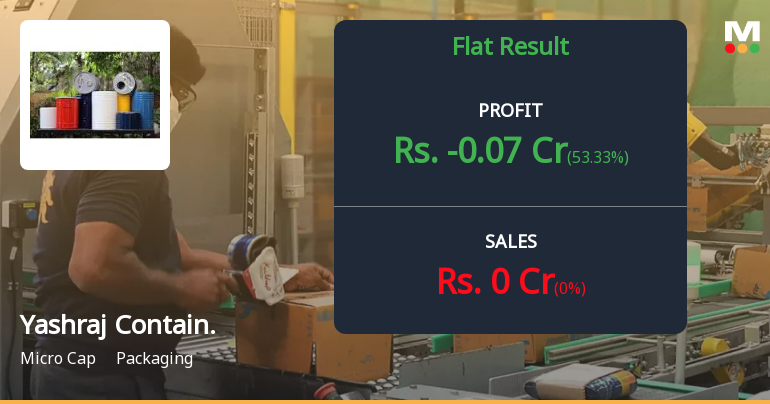
Yashraj Containeurs Q4 FY26: Operational Standstill Deepens as Losses Mount
Yashraj Containeurs Limited, a Mumbai-based manufacturer of steel barrels and containers, reported another quarter of operational paralysis in Q4 FY26 (January-March 2026), with net sales remaining at absolute zero for the seventh consecutive quarter. The micro-cap company, with a market capitalisation of just ₹8.45 crores, posted a net loss of ₹0.07 crores for the quarter, marginally better than the ₹0.15 crores loss recorded in Q3 FY26. The stock traded at ₹4.97 on June 01, 2026, down 37.88% over the past year and a staggering 63.32% over three years, reflecting sustained investor concern about the company's complete cessation of manufacturing activities.
Read full news article Announcements
Compliances-Certificate under Reg. 74 (5) of SEBI (DP) Regulations 2018
15-Jul-2026 | Source : BSECertificate under Reg. 74(5) of SEBI (DP) Regulations 2018
Revised Financial Results.
27-Jun-2026 | Source : BSERevised Financial Results for the Year ended 31 March 2026.
Closure of Trading Window
26-Jun-2026 | Source : BSEClosure of Trading Window.
Corporate Actions

No Upcoming Board Meetings

No Dividend history available

No Splits history available

No Bonus history available

No Rights history available
Quality key factors
Valuation key factors
Technicals key factors
 Technical Indicator Scale: Bearish, Mildly Bearish, Sideways, Mildly Bullish, Bullish Turned
 Shareholding Snapshot : Jun 2026
Shareholding Compare (%holding)
Promoters
10.5567
Held by 0 Schemes
Held by 0 FIIs
Sangeeta Jayesh Valia (17.74%)
A. K. Services Pvt Ltd (1.54%)
21.02%
Quarterly Results Snapshot (Standalone) - Mar'26 - QoQ
QoQ Growth in quarter ended Mar 2026 is 0.00% vs 0.00% in Dec 2025

QoQ Growth in quarter ended Mar 2026 is 53.33% vs 31.82% in Dec 2025
Half Yearly Results Snapshot (Standalone) - Sep'25

Growth in half year ended Sep 2025 is -100.00% vs -67.89% in Sep 2024
Growth in half year ended Sep 2025 is -150.00% vs 127.41% in Sep 2024
Nine Monthly Results Snapshot (Standalone) - Dec'25
YoY Growth in nine months ended Dec 2025 is -100.00% vs -75.52% in Dec 2024
YoY Growth in nine months ended Dec 2025 is -190.77% vs 114.57% in Dec 2024
Annual Results Snapshot (Standalone) - Mar'26
YoY Growth in year ended Mar 2026 is -100.00% vs -82.23% in Mar 2025
YoY Growth in year ended Mar 2026 is 97.27% vs -313.33% in Mar 2025
About Yashraj Containeurs Ltd

Company Coordinates


