
Compare Yext, Inc. with Similar Stocks
Dashboard
1
Poor Management Efficiency with a low ROE of 1.39%
- The company has been able to generate a Return on Equity (avg) of 1.39% signifying low profitability per unit of shareholders funds
2
The company has declared Positive results for the last 3 consecutive quarters
3
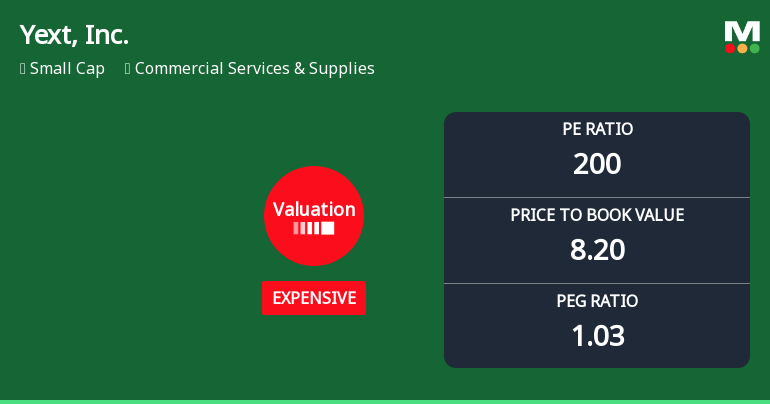
With ROE of 4.10%, it has a risky valuation with a 8.20 Price to Book Value
4
High Institutional Holdings at 84.62%
Stock DNA
Commercial Services & Supplies
USD 947 Million (Small Cap)
200.00
NA
0.00%
-0.19
13.42%
6.10
Revenue and Profits:
Net Sales:
112 Million
(Quarterly Results - Oct 2025)
Net Profit:
6 Million
Total Returns (Price + Dividend) 
TimePeriod
Price Return
Dividend Return
Total Return
3 Months
-18.99%
0%
-18.99%
6 Months
-29.32%
0%
-29.32%
1 Year
-0.99%
0%
-0.99%
2 Years
-61.5%
0%
-61.5%
3 Years
-11.37%
0%
-11.37%
4 Years
-65.54%
0%
-65.54%
5 Years
-69.14%
0%
-69.14%
Yext, Inc. for the last several years.
Risk Adjusted Returns v/s
News
Yext, Inc. Experiences Revision in Its Stock Evaluation Amid Competitive Market Landscape
Yext, Inc. has recently adjusted its valuation, showcasing a high P/E ratio of 200 and a price-to-book value of 8.20. Despite a year-to-date return of 33.33%, the company has struggled over five years with a -55.86% return, contrasting with the S&P 500's growth.
Read full news article Announcements

No announcement available
Corporate Actions
No corporate action available
Quality key factors
Factor
Value
Sales Growth (5y)
6.61%
EBIT Growth (5y)
15.50%
EBIT to Interest (avg)
-45.11
Debt to EBITDA (avg)
Negative Net Debt
Net Debt to Equity (avg)
-0.80
Sales to Capital Employed (avg)
2.30
Tax Ratio
1.47%
Dividend Payout Ratio
0
Pledged Shares
0
Institutional Holding
85.95%
ROCE (avg)
5.07%
ROE (avg)
1.39%
Valuation key factors
Factor
Value
P/E Ratio
200
Industry P/E
Price to Book Value
8.20
EV to EBIT
321.21
EV to EBITDA
30.35
EV to Capital Employed
36.39
EV to Sales
2.42
PEG Ratio
1.03
Dividend Yield
NA
ROCE (Latest)
11.33%
ROE (Latest)
4.10%
Technicals key factors
Indicator
Weekly
Monthly
MACD
Bearish
Bearish
RSI
Bullish
No Signal
Bollinger Bands
Bearish
Bearish
Moving Averages
Bearish (Daily)
KST
Bearish
Bullish
Dow Theory
Mildly Bearish
Mildly Bearish
OBV
Mildly Bearish
Mildly Bearish
 Technical Indicator Scale: Bearish, Mildly Bearish, Sideways, Mildly Bullish, Bullish Turned
 Shareholding Snapshot : Oct 2025
Shareholding Compare (%holding)
Majority shareholders
Domestic Funds
Domestic Funds
Held in 58 Schemes (27.69%)
Foreign Institutions
Held by 95 Foreign Institutions (12.38%)
Strategic Entities with highest holding
Highest Public shareholder
Quarterly Results Snapshot (Consolidated) - Oct'25 - QoQ
Oct'25
Jul'25
Change(%)
Net Sales
112.00
113.10
-0.97%
Operating Profit (PBDIT) excl Other Income
16.30
15.80
3.16%
Interest
2.40
2.30
4.35%
Exceptional Items
0.60
23.10
-97.40%
Consolidate Net Profit
6.10
26.80
-77.24%
Operating Profit Margin (Excl OI)
64.50%
58.50%
0.60%
USD in Million.

Net Sales
QoQ Growth in quarter ended Oct 2025 is -0.97% vs 3.29% in Jul 2025
Consolidated Net Profit
QoQ Growth in quarter ended Oct 2025 is -77.24% vs 3,250.00% in Jul 2025
Annual Results Snapshot (Consolidated) - Jan'25
Jan'25
Jan'24
Change(%)
Net Sales
421.00
404.30
4.13%
Operating Profit (PBDIT) excl Other Income
24.00
18.40
30.43%
Interest
1.00
0.50
100.00%
Exceptional Items
-29.20
0.00
Consolidate Net Profit
-27.90
-2.60
-973.08%
Operating Profit Margin (Excl OI)
-7.80%
-15.30%
0.75%
USD in Million.

Net Sales
YoY Growth in year ended Jan 2025 is 4.13% vs 0.85% in Jan 2024
Consolidated Net Profit
YoY Growth in year ended Jan 2025 is -973.08% vs 96.05% in Jan 2024
About Yext, Inc.

Yext, Inc.
Commercial Services & Supplies
Yext Inc. is a knowledge engine provider. Yext puts business on the map. The Yext Knowledge Engine enables companies to manage their digital knowledge in the cloud and sync it to over 100 services in the PowerListings Network, including Apple Maps, Bing, Cortana, Facebook, Google, Google Maps, Instagram, Siri and Yelp. Yext Listings, Pages and Reviews help businesses around the globe and facilitate face-to-face digital interactions. Yext Knowledge Engine enables businesses to control and manage their digital knowledge and makes it available through the PowerListings Network of over 100 third-party maps, apps, search engines, intelligent GPS systems, digital assistants, vertical directories and social networks in a complete, up to date and accurate manner.
Company Coordinates


InfinHub Market Technologies FZ-LLC, Building-2, Unit 112, Dubai Internet City, Dubai, United Arab Emirates
GET THE MARKETSMOJO APP


Company
Stocks
Portfolio


"Investment in securities markets are subject to market risk. Read all the related documents carefully before investing."