
Compare York Exports with Similar Stocks
Dashboard
Weak Long Term Fundamental Strength with an average Return on Capital Employed (ROCE) of 6.76%
- Poor long term growth as Net Sales has grown by an annual rate of 7.11% over the last 5 years
- Low ability to service debt as the company has a high Debt to EBITDA ratio of 10.51 times
Flat results in Mar 26
Stock DNA
Gems, Jewellery And Watches
INR 18 Cr (Micro Cap)
3.00
25
0.00%
1.88
21.66%
0.68
Total Returns (Price + Dividend) 
York Exports for the last several years.
Risk Adjusted Returns v/s
Returns Beta

News
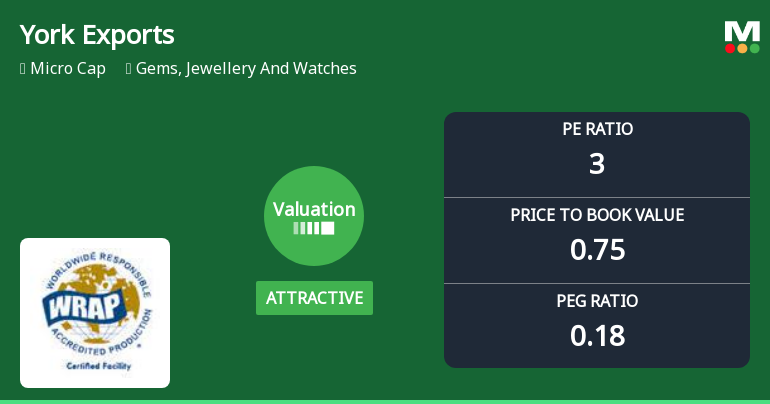
York Exports Ltd Valuation Shifts Signal Renewed Price Attractiveness Amid Mixed Market Returns
York Exports Ltd, a micro-cap player in the Gems, Jewellery and Watches sector, has seen a notable shift in its valuation parameters, moving from very attractive to attractive territory. Despite a recent upgrade in valuation grades, the company’s overall market sentiment remains cautious, reflected in its Strong Sell mojo grade. This article analyses the evolving price attractiveness of York Exports, comparing its valuation metrics with peers and historical benchmarks to provide investors with a comprehensive perspective.
Read full news article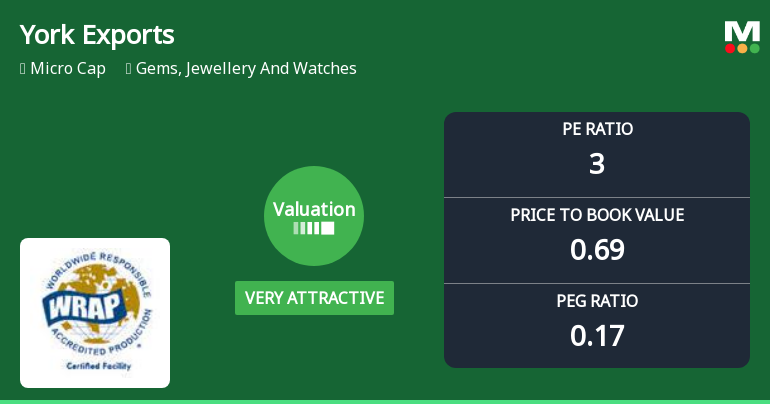
York Exports Ltd Valuation Shifts to Very Attractive Amid Market Volatility
York Exports Ltd, a micro-cap player in the Gems, Jewellery and Watches sector, has seen a significant shift in its valuation parameters, moving from an attractive to a very attractive rating. Despite recent price declines and a challenging market environment, the company’s low price-to-earnings and price-to-book ratios suggest compelling value relative to peers and historical benchmarks.
Read full news articleAre York Exports Ltd latest results good or bad?
York Exports Ltd's latest financial results for Q4 FY26 reveal significant operational challenges. The company reported consolidated net sales of ₹1.43 crores, which reflects a substantial decline of 90.57% compared to the previous quarter and a 54.75% decrease year-on-year. This sharp drop in revenue indicates severe volatility in sales, raising concerns about the company's ability to maintain consistent order flows and customer relationships in the garment export sector. Consolidated net profit for the quarter was ₹0.08 crores, down 89.04% from the previous quarter and 33.33% year-on-year. While the operating margin improved to 55.94%, this increase appears driven by a disproportionate decline in operating expenses rather than genuine operational improvement, suggesting that the margin expansion may not be sustainable. The company's standalone net profit turned negative, highlighting further financial st...
Read full news article Announcements
Intimation Under Regulation 30 Of The SEBI (Listing Obligations & Disclosure Requirements) Regulations 2025
08-Jun-2026 | Source : BSEThis is with reference to the email communication received from BSE Limited seeking clarification for a significant movement in the price of the securities of the company
Announcement under Regulation 30 (LODR)-Newspaper Publication
01-Jun-2026 | Source : BSEWe enclosed the Copies of Newspaper Clippings of the advertisement published on 31.05.2026 on the subject matter in the following newspapers: 1. Uttam Hindu in Hindi 2. Financial Express in English.
Board Meeting Outcome for Outcome Of The Board Meeting
30-May-2026 | Source : BSEThis is to inform you that the Meeting of Board of Directors of the company has been duly convened today i.e. on 30th May 2026. The Board has approved the audited financial results for the year ended 31st March 2026. The Board meeting commenced at 2.00 P.M. and concluded at 03.00 P.M.
Corporate Actions

No Upcoming Board Meetings

No Dividend history available

No Splits history available

No Bonus history available

No Rights history available
Quality key factors
Valuation key factors
Technicals key factors
 Technical Indicator Scale: Bearish, Mildly Bearish, Sideways, Mildly Bullish, Bullish Turned
 Shareholding Snapshot : Mar 2026
Shareholding Compare (%holding)
Promoters
None
Held by 0 Schemes
Held by 0 FIIs
York E-retail Private Limited (14.99%)
Xtended Business Reporting Limited (1.11%)
23.27%
Quarterly Results Snapshot (Consolidated) - Mar'26 - QoQ

QoQ Growth in quarter ended Mar 2026 is -90.57% vs 92.39% in Dec 2025
QoQ Growth in quarter ended Mar 2026 is -89.04% vs -84.60% in Dec 2025
Half Yearly Results Snapshot (Consolidated) - Sep'25
Growth in half year ended Sep 2025 is -34.50% vs 1.30% in Sep 2024

Growth in half year ended Sep 2025 is 569.86% vs -19.78% in Sep 2024
Nine Monthly Results Snapshot (Consolidated) - Dec'25
YoY Growth in nine months ended Dec 2025 is -10.84% vs 8.21% in Dec 2024
YoY Growth in nine months ended Dec 2025 is 20.60% vs 385.42% in Dec 2024
Annual Results Snapshot (Consolidated) - Mar'26
YoY Growth in year ended Mar 2026 is -14.77% vs 11.05% in Mar 2025
YoY Growth in year ended Mar 2026 is 19.25% vs 1,670.37% in Mar 2025
About York Exports Ltd

Company Coordinates


