
Compare Yuvraaj Hygiene with Similar Stocks
Total Returns (Price + Dividend) 
Yuvraaj Hygiene for the last several years.
Risk Adjusted Returns v/s
Returns Beta

News
Yuvraaj Hygiene Products Ltd is Rated Strong Sell
Yuvraaj Hygiene Products Ltd is rated Strong Sell by MarketsMOJO, with this rating last updated on 14 February 2026. However, the analysis and financial metrics discussed here reflect the stock’s current position as of 28 June 2026, providing investors with the most recent and relevant data to assess the company’s outlook.
Read full news article
Yuvraaj Hygiene Products Ltd is Rated Strong Sell
Yuvraaj Hygiene Products Ltd is rated Strong Sell by MarketsMOJO. This rating was last updated on 14 February 2026. However, the analysis and financial metrics discussed below reflect the stock’s current position as of 17 June 2026, providing investors with the latest insights into the company’s performance and outlook.
Read full news article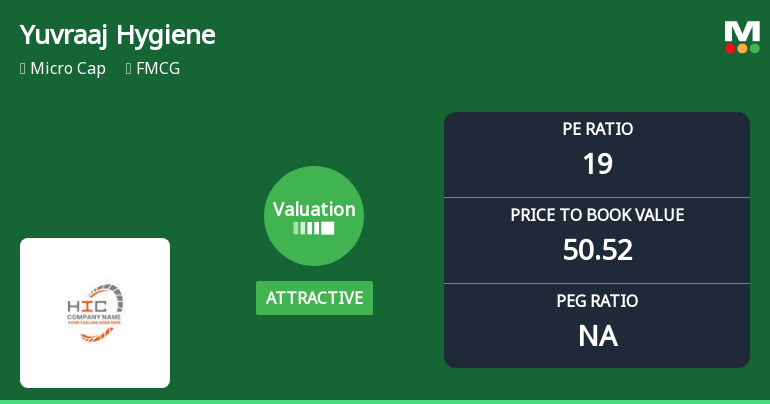
Yuvraaj Hygiene Products Ltd Valuation Shifts Signal Renewed Price Attractiveness
Yuvraaj Hygiene Products Ltd, a micro-cap player in the FMCG sector, has seen its valuation parameters shift notably, with its price-to-earnings (P/E) ratio now deemed attractive compared to historical and peer averages. Despite a challenging market environment reflected in its share price decline, the company’s improved valuation metrics and robust return on equity (ROE) and capital employed (ROCE) ratios offer a nuanced perspective for investors assessing its price attractiveness.
Read full news article Announcements
Closure of Trading Window
26-Jun-2026 | Source : BSEPursuant to provisions of SEBI (PIT) Regulation 2015 we wish to inform you that in terms of companys code of conduct for regulating monitoring and reporting of trading by insiders the trading window for dealing in securities of the company will remain closed for all designated persons and their immediate relatives from Wednesday July 01 2026 till 48 hours after the declaration of un-audited financial results for the quarter ended June 30 2026.
Compliances-Reg.24(A)-Annual Secretarial Compliance
29-May-2026 | Source : BSENon Applicability of Regulation 24A of SEBI (LODR) Regulations 2015 for the Financial Year 2025-2026.
Announcement under Regulation 30 (LODR)-Newspaper Publication
29-May-2026 | Source : BSEPursuant to Regulation 47 of SEBI(LODR) Regulations 2015 we herein enclose copy of newspaper advertisement of the Audited financial results for the quarter and financial year ended March 31 2026
Corporate Actions

No Upcoming Board Meetings

No Dividend history available

No Splits history available

No Bonus history available

No Rights history available
Quality key factors
Valuation key factors
Technicals key factors
 Technical Indicator Scale: Bearish, Mildly Bearish, Sideways, Mildly Bullish, Bullish Turned
 Shareholding Snapshot : Mar 2026
Shareholding Compare (%holding)
Promoters
None
Held by 0 Schemes
Held by 0 FIIs
Vishal Sudhir Kampani (33.15%)
Arwa Umesh (3.29%)
35.35%
Quarterly Results Snapshot (Standalone) - Mar'26 - YoY

YoY Growth in quarter ended Mar 2026 is 33.85% vs 90.38% in Mar 2025
YoY Growth in quarter ended Mar 2026 is -40.94% vs 482.05% in Mar 2025
Half Yearly Results Snapshot (Standalone) - Sep'25
Growth in half year ended Sep 2025 is -5.14% vs 103.30% in Sep 2024
Growth in half year ended Sep 2025 is 1.62% vs 2,742.86% in Sep 2024
Nine Monthly Results Snapshot (Standalone) - Dec'25
YoY Growth in nine months ended Dec 2025 is -28.53% vs 161.87% in Dec 2024
YoY Growth in nine months ended Dec 2025 is -44.39% vs 8,640.00% in Dec 2024
Annual Results Snapshot (Standalone) - Mar'26
YoY Growth in year ended Mar 2026 is -16.27% vs 143.91% in Mar 2025
YoY Growth in year ended Mar 2026 is -43.61% vs 1,826.47% in Mar 2025
About Yuvraaj Hygiene Products Ltd

Company Coordinates


