
Compare Z-Tech (India) with Similar Stocks
Dashboard
Strong ability to service debt as the company has a low Debt to EBITDA ratio of 1.74 times
Healthy long term growth as Net Sales has grown by an annual rate of 50.20% and Operating profit at 154.51%
With a growth in Net Profit of 151.18%, the company declared Very Positive results in Mar 26
Increasing Participation by Institutional Investors
Stock DNA
Industrial Manufacturing
INR 863 Cr (Micro Cap)
43.00
37
0.00%
0.33
18.89%
4.55
Total Returns (Price + Dividend) 
Z-Tech (India) for the last several years.
Risk Adjusted Returns v/s
Returns Beta

News
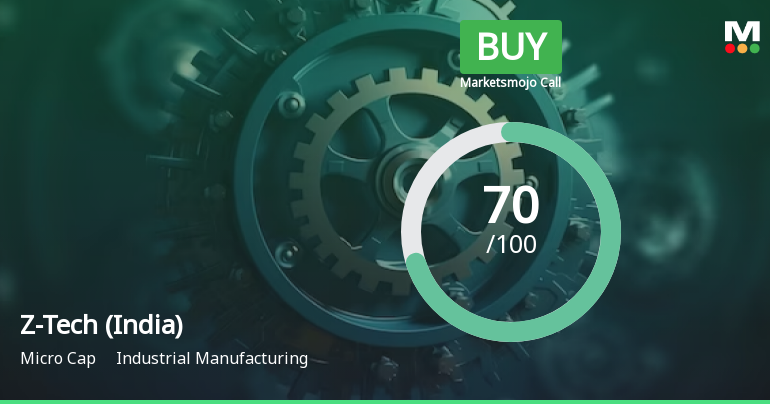
Z-Tech (India) Ltd is Rated Buy by MarketsMOJO
Z-Tech (India) Ltd is rated 'Buy' by MarketsMOJO, with this rating last updated on 15 June 2026. However, the analysis and financial metrics presented here reflect the stock's current position as of 20 June 2026, providing investors with the latest insights into its performance and outlook.
Read full news article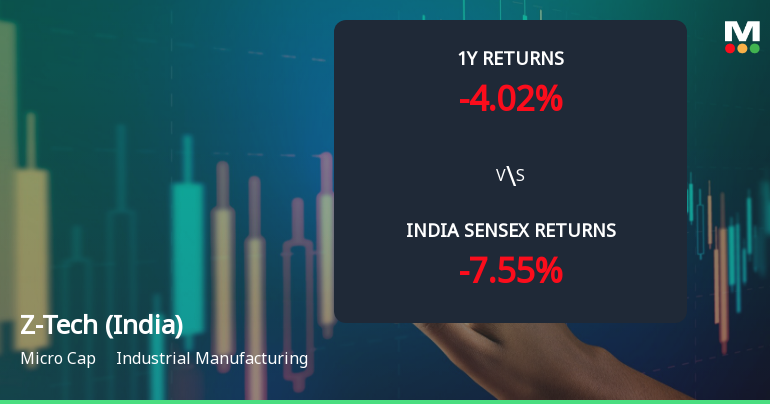
Z-Tech (India) Ltd Technical Momentum Shifts to Bullish Amid Mixed Returns
Z-Tech (India) Ltd, a micro-cap player in the industrial manufacturing sector, has witnessed a notable shift in its technical momentum, moving from a mildly bullish stance to a more confident bullish trend. Despite mixed returns relative to the broader Sensex index, recent technical indicators suggest a strengthening price momentum that investors should carefully consider.
Read full news article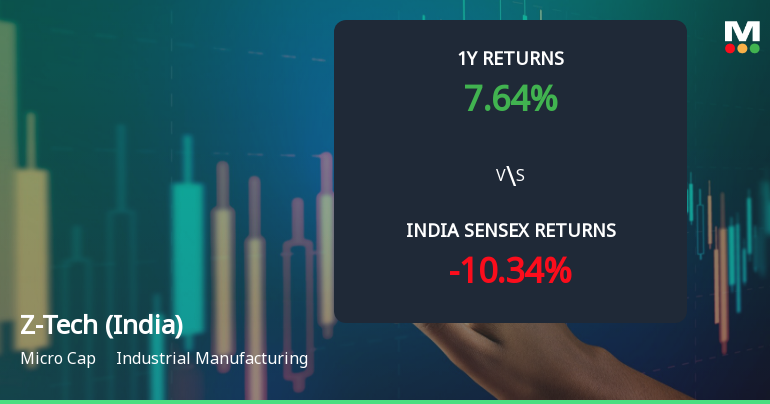
Z-Tech (India) Ltd Technical Momentum Shifts Amid Mixed Market Returns
Z-Tech (India) Ltd, a micro-cap player in the industrial manufacturing sector, has experienced a subtle shift in its technical momentum, moving from a bullish to a mildly bullish stance. Despite a slight dip in its share price, the stock’s technical indicators present a nuanced picture, reflecting both resilience and caution amid broader market fluctuations.
Read full news article Announcements
Corporate Actions

No Upcoming Board Meetings

No Dividend history available

No Splits history available

No Bonus history available

No Rights history available
Quality key factors
Valuation key factors
Technicals key factors
 Technical Indicator Scale: Bearish, Mildly Bearish, Sideways, Mildly Bullish, Bullish Turned
 Shareholding Snapshot : Mar 2026
Shareholding Compare (%holding)
Promoters
None
Held by 0 Schemes
Held by 4 FIIs (4.47%)
Terramaya Enterprises Private Limited (52.64%)
Ashish Kacholia (3.71%)
33.57%
Quarterly Results Snapshot (Standalone) - Mar'26 - QoQ

QoQ Growth in quarter ended Mar 2026 is 40.10% vs 21.71% in Dec 2025
QoQ Growth in quarter ended Mar 2026 is 151.18% vs 25.74% in Dec 2025
Half Yearly Results Snapshot (Standalone) - Mar'26
Growth in half year ended Mar 2026 is 83.38% vs -7.00% in Sep 2025
Growth in half year ended Mar 2026 is 194.07% vs -36.19% in Sep 2025
Nine Monthly Results Snapshot (Standalone) - Dec'25
YoY Growth in nine months ended Dec 2025 is 63.22% vs 31.50% in Dec 2024

YoY Growth in nine months ended Dec 2025 is 50.50% vs 92.55% in Dec 2024
Annual Results Snapshot (Standalone) - Mar'26
YoY Growth in year ended Mar 2026 is 65.03% vs 40.23% in Mar 2025
YoY Growth in year ended Mar 2026 is 82.87% vs 131.80% in Mar 2025
About Z-Tech (India) Ltd

Company Coordinates


