
Compare Zaggle Prepaid with Similar Stocks
Dashboard
Poor Management Efficiency with a low ROE of 8.44%
- The company has been able to generate a Return on Equity (avg) of 8.44% signifying low profitability per unit of shareholders funds
The company is Net-Debt Free
Healthy long term growth as Net Sales has grown by an annual rate of 56.83% and Operating profit at 54.28%
With a growth in Net Sales of 17.58%, the company declared Very Positive results in Mar 26
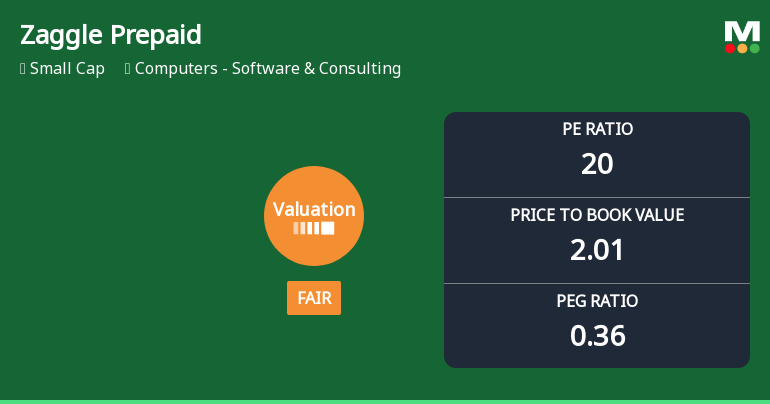
With ROE of 9.8, it has a Fair valuation with a 2 Price to Book Value
Falling Participation by Institutional Investors
Stock DNA
Computers - Software & Consulting
INR 2,805 Cr (Small Cap)
20.00
20
0.00%
-0.35
9.83%
2.01
Total Returns (Price + Dividend) 
Zaggle Prepaid for the last several years.
Risk Adjusted Returns v/s
Returns Beta

News
Zaggle Prepaid Ocean Services Ltd: Valuation Shift Signals Fair Price Amid Sector Pressure
Zaggle Prepaid Ocean Services Ltd has witnessed a notable shift in its valuation parameters, moving from an attractive to a fair valuation grade as of mid-June 2026. This change reflects evolving market perceptions amid a challenging sector environment and a significant correction in the stock price over the past year. Investors are now reassessing the company’s price-to-earnings (P/E) and price-to-book value (P/BV) ratios relative to historical levels and peer benchmarks, prompting a Hold rating upgrade from Sell by MarketsMOJO.
Read full news article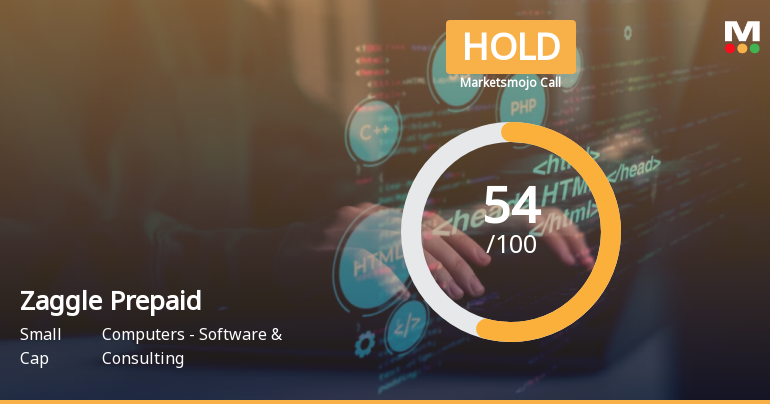
Zaggle Prepaid Ocean Services Ltd is Rated Hold by MarketsMOJO
Zaggle Prepaid Ocean Services Ltd is rated 'Hold' by MarketsMOJO, with this rating last updated on 15 June 2026. However, the analysis and financial metrics discussed here reflect the stock's current position as of 21 June 2026, providing investors with the most up-to-date insight into the company’s performance and outlook.
Read full news article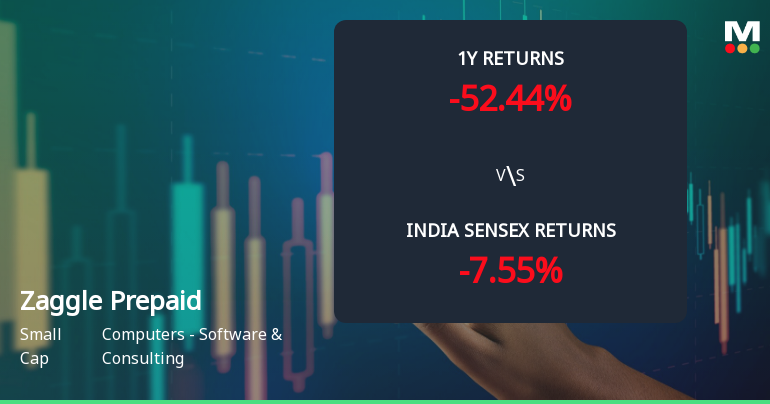
Zaggle Prepaid Ocean Services Ltd Sees Mixed Technical Signals Amid Price Momentum Shift
Zaggle Prepaid Ocean Services Ltd, a small-cap player in the Computers - Software & Consulting sector, has experienced a notable shift in price momentum and technical indicators. Despite a strong intraday gain of 7.23% to close at ₹209.15 on 15 Jun 2026, the company’s technical profile remains mixed, reflecting a complex outlook for investors amid broader market challenges.
Read full news article Announcements
Announcement under Regulation 30 (LODR)-Award_of_Order_Receipt_of_Order
19-Jun-2026 | Source : BSEPursuant to Regulation 30 of SEBI (LODR) Regulations 2015 this is to inform you that Zaggle Prepaid Ocean Services Limited has entered into an agreement with Punjab National Bank
Announcement under Regulation 30 (LODR)-Analyst / Investor Meet - Intimation
17-Jun-2026 | Source : BSEIntimation of Schedule of Analyst / Institutional Investor meetings
Announcement under Regulation 30 (LODR)-Updates on Acquisition
12-Jun-2026 | Source : BSEUpdate on Acquisition of Compulsory Convertible Preference Shares in Rivpe Technology Private Limited
Corporate Actions

No Upcoming Board Meetings

No Dividend history available

No Splits history available

No Bonus history available

No Rights history available
Quality key factors
Valuation key factors
Technicals key factors
 Technical Indicator Scale: Bearish, Mildly Bearish, Sideways, Mildly Bullish, Bullish Turned
 Shareholding Snapshot : Mar 2026
Shareholding Compare (%holding)
Non Institution
0.5462
Held by 8 Schemes (3.0%)
Held by 32 FIIs (4.06%)
Raj P Narayanam (34.33%)
Zuzu Software Services Llp (3.89%)
34.86%
Quarterly Results Snapshot (Consolidated) - Mar'26 - QoQ

QoQ Growth in quarter ended Mar 2026 is 17.58% vs 21.59% in Dec 2025

QoQ Growth in quarter ended Mar 2026 is 11.57% vs 4.00% in Dec 2025
Half Yearly Results Snapshot (Consolidated) - Sep'25
Growth in half year ended Sep 2025 is 37.75% vs 83.26% in Sep 2024
Growth in half year ended Sep 2025 is 65.00% vs 284.13% in Sep 2024
Nine Monthly Results Snapshot (Consolidated) - Dec'25
YoY Growth in nine months ended Dec 2025 is 44.65% vs 77.54% in Dec 2024
YoY Growth in nine months ended Dec 2025 is 71.70% vs 128.40% in Dec 2024
Annual Results Snapshot (Consolidated) - Mar'26
YoY Growth in year ended Mar 2026 is 46.32% vs 68.10% in Mar 2025
YoY Growth in year ended Mar 2026 is 57.05% vs 99.73% in Mar 2025
About Zaggle Prepaid Ocean Services Ltd

Company Coordinates


