
Compare Zee Entertainmen with Similar Stocks
Dashboard
Poor long term growth as Operating profit has grown by an annual rate -32.85% of over the last 5 years
With a fall in Net Sales of -11.2%, the company declared Very Negative results in Mar 26
With ROE of 2.4, it has a Very Expensive valuation with a 0.9 Price to Book Value
Consistent Underperformance against the benchmark over the last 3 years
Stock DNA
Media & Entertainment
INR 10,004 Cr (Small Cap)
37.00
21
2.24%
-0.21
2.38%
0.89
Total Returns (Price + Dividend) 
Latest dividend: 2.43 per share ex-dividend date: Aug-29-2025
Risk Adjusted Returns v/s
Returns Beta

News
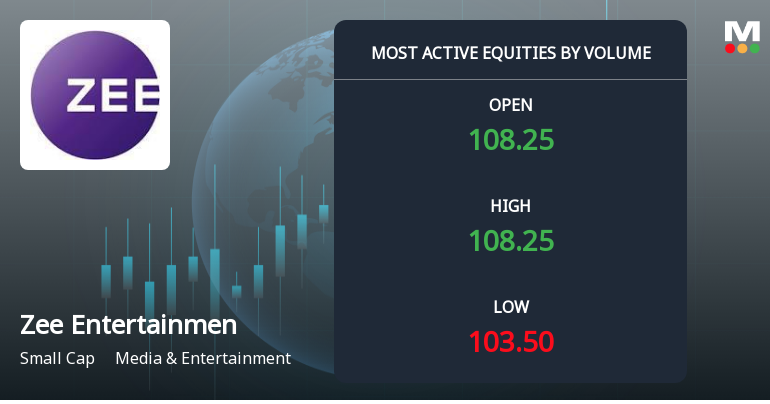
Zee Entertainment Sees Heavy Volume Amid Price Decline and Sell Rating
Zee Entertainment Enterprises Ltd (ZEEL) emerged as one of the most actively traded stocks on 2 July 2026, registering a total traded volume exceeding 1.31 crore shares. Despite this surge in activity, the stock underperformed its sector and broader market indices, reflecting a cautious investor stance amid a notable downgrade in its mojo rating.
Read full news article
Zee Entertainment Enterprises Ltd Sees Surge in Value Trading Amid Sector Outperformance
Zee Entertainment Enterprises Ltd (ZEEL) emerged as one of the most actively traded stocks by value on 1 July 2026, registering a robust intraday performance that outpaced its sector and the broader market. The media and entertainment company witnessed a significant surge in trading volumes and value, reflecting renewed investor interest and a potential trend reversal after a brief period of decline.
Read full news article
Zee Entertainment Enterprises Ltd Surges 7.13% to Day's High of Rs 112 — Outperforms Sector by 4.4 Percentage Points
The Sensex rose 0.55% on 1 Jul 2026, yet Zee Entertainment Enterprises Ltd outpaced both the benchmark and its sector with a 7.13% gain, reaching an intraday high of Rs 112. This 4.4-percentage-point outperformance over the Media & Entertainment sector’s 2.9% advance signals a distinctly stock-specific momentum shift.
Read full news article Announcements
Zee Entertainment Enterprises Limited - Updates
28-Nov-2019 | Source : NSEZee Entertainment Enterprises Limited has informed the Exchange regarding 'Compliance under Sub Clause 7B of Clause A of Part A of Schedule III of
Zee Entertainment Enterprises Limited - Clarification
27-Nov-2019 | Source : NSEZee Entertainment Enterprises Limitedd with respect to announcements made by the Company pertaining to Resignation of Directors. The response of the Company is awaited.
Zee Entertainment Enterprises Limited - Change in Company Secretary / Compliance Officer
26-Nov-2019 | Source : NSEZee Entertainment Enterprises Limited has informed the Exchange about resignation of Mr M Lakshminarayanan as Company Secretary & Chief Compliance Officer and Appointment of Mr Ashish Agarwal as a Company Secretary of the Company w.e.f. November 26, 2019
Corporate Actions

No Upcoming Board Meetings

Zee Entertainment Enterprises Ltd has declared 243% dividend, ex-date: 29 Aug 25

No Splits history available

Zee Entertainment Enterprises Ltd has announced 1:1 bonus issue, ex-date: 11 Nov 10

No Rights history available
Quality key factors
Valuation key factors
Technicals key factors
 Technical Indicator Scale: Bearish, Mildly Bearish, Sideways, Mildly Bullish, Bullish Turned
 Shareholding Snapshot : Mar 2026
Shareholding Compare (%holding)
Non Institution
5.3763
Held by 17 Schemes (4.86%)
Held by 197 FIIs (25.33%)
Essel Media Ventures Limited (3.45%)
Life Insurance Corporation Of India (4.49%)
42.28%
Quarterly Results Snapshot (Consolidated) - Mar'26 - QoQ

QoQ Growth in quarter ended Mar 2026 is -11.20% vs 15.79% in Dec 2025
QoQ Growth in quarter ended Mar 2026 is -166.77% vs 103.01% in Dec 2025
Half Yearly Results Snapshot (Consolidated) - Sep'25
Growth in half year ended Sep 2025 is -8.16% vs -6.57% in Sep 2024
Growth in half year ended Sep 2025 is -32.76% vs 371.22% in Sep 2024
Nine Monthly Results Snapshot (Consolidated) - Dec'25

YoY Growth in nine months ended Dec 2025 is -0.59% vs -5.52% in Dec 2024
YoY Growth in nine months ended Dec 2025 is -23.54% vs 283.67% in Dec 2024
Annual Results Snapshot (Consolidated) - Mar'26
YoY Growth in year ended Mar 2026 is -2.35% vs -3.97% in Mar 2025
YoY Growth in year ended Mar 2026 is -60.07% vs 380.55% in Mar 2025
About Zee Entertainment Enterprises Ltd

Company Coordinates


