
Compare Zee Media with Similar Stocks
Dashboard
With a Operating Losses, the company has a Weak Long Term Fundamental Strength
- Company's ability to service its debt is weak with a poor EBIT to Interest (avg) ratio of -1.20
- The company has been able to generate a Return on Equity (avg) of 4.73% signifying low profitability per unit of shareholders funds
Flat results in Mar 26
With ROCE of 0.5, it has a Expensive valuation with a 1.9 Enterprise value to Capital Employed
Below par performance in long term as well as near term
Stock DNA
Media & Entertainment
INR 508 Cr (Micro Cap)
76.00
18
0.00%
0.33
2.99%
2.28
Total Returns (Price + Dividend) 
Latest dividend: 0.15 per share ex-dividend date: Jul-28-2016
Risk Adjusted Returns v/s
Returns Beta

News

Zee Media Corporation Ltd is Rated Strong Sell
Zee Media Corporation Ltd is rated Strong Sell by MarketsMOJO, with this rating last updated on 30 May 2026. However, the analysis and financial metrics presented here reflect the stock’s current position as of 13 July 2026, providing investors with an up-to-date view of the company’s fundamentals, valuation, financial trends, and technical outlook.
Read full news article
Zee Media Corporation Ltd is Rated Strong Sell
Zee Media Corporation Ltd is rated Strong Sell by MarketsMOJO. This rating was last updated on 30 May 2026, reflecting a reassessment of the stock’s outlook. However, all fundamentals, returns, and financial metrics discussed here are based on the company’s current position as of 02 July 2026, providing investors with the latest comprehensive view of the stock’s performance and prospects.
Read full news article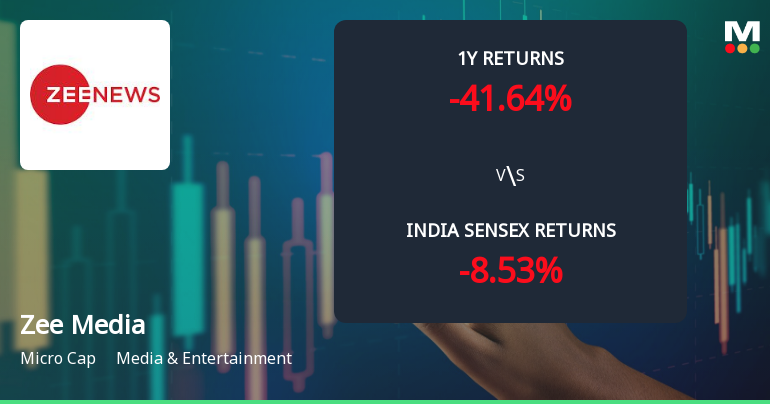
Zee Media Corporation Ltd Technical Momentum Shifts Amid Mixed Indicator Signals
Zee Media Corporation Ltd has exhibited a nuanced shift in its technical momentum, moving from a bearish stance to a mildly bearish outlook, reflecting a complex interplay of technical indicators. Despite a notable day gain of 5.32%, the micro-cap media company faces mixed signals from key momentum and trend indicators, underscoring the challenges investors face in navigating its near-term trajectory.
Read full news article Announcements
Zee Media Corporation Limited - Other General Purpose
21-Nov-2019 | Source : NSEZee Media Corporation Limited has submitted to the Exchange a copy of Disclosure of Related Party Transactions pursuant to Regulation 23(9) of SEBI (Listing Obligations and Disclosure Requirements) Regulations, 2015.
Appointment
20-Sep-2019 | Source : NSE
| Zee Media Corporation Limited has informed the Exchange regarding Appointment of Mr Sudhir Chaudhary as Chief Executive Officer of the company w.e.f. September 20, 2019. |
Cessation
12-Sep-2019 | Source : NSE
| Zee Media Corporation Limited has informed the Exchange regarding Cessation of Mr Sumit Kapoor as Chief Financial Officer of the company w.e.f. September 14, 2019. |
Corporate Actions

No Upcoming Board Meetings

Zee Media Corporation Ltd has declared 15% dividend, ex-date: 28 Jul 16

No Splits history available

No Bonus history available

Zee Media Corporation Ltd has announced 3:10 rights issue, ex-date: 16 Mar 15
Quality key factors
Valuation key factors
Technicals key factors
 Technical Indicator Scale: Bearish, Mildly Bearish, Sideways, Mildly Bullish, Bullish Turned
 Shareholding Snapshot : Jun 2026
Shareholding Compare (%holding)
Non Institution
None
Held by 0 Schemes
Held by 36 FIIs (19.75%)
Auv Innovations Llp (8.98%)
Miloeux Media And Entertainment Private Limited (16%)
42.21%
Quarterly Results Snapshot (Consolidated) - Mar'26 - QoQ

QoQ Growth in quarter ended Mar 2026 is -34.35% vs 34.47% in Dec 2025
QoQ Growth in quarter ended Mar 2026 is -150.27% vs 439.79% in Dec 2025
Half Yearly Results Snapshot (Consolidated) - Sep'25

Growth in half year ended Sep 2025 is 17.75% vs 5.02% in Sep 2024
Growth in half year ended Sep 2025 is 59.59% vs -7.55% in Sep 2024
Nine Monthly Results Snapshot (Consolidated) - Dec'25
YoY Growth in nine months ended Dec 2025 is 29.03% vs 1.48% in Dec 2024
YoY Growth in nine months ended Dec 2025 is 134.39% vs 10.07% in Dec 2024
Annual Results Snapshot (Consolidated) - Mar'26
YoY Growth in year ended Mar 2026 is 22.07% vs -2.57% in Mar 2025
YoY Growth in year ended Mar 2026 is 101.59% vs -21.32% in Mar 2025
About Zee Media Corporation Ltd

Company Coordinates


