
Compare Zensar Tech. with Similar Stocks
Stock DNA
Computers - Software & Consulting
INR 11,536 Cr (Small Cap)
15.00
21
2.87%
-0.53
16.81%
2.52
Total Returns (Price + Dividend) 
Latest dividend: 12.562435083669937 per share ex-dividend date: Jul-17-2026
Risk Adjusted Returns v/s
Returns Beta

News
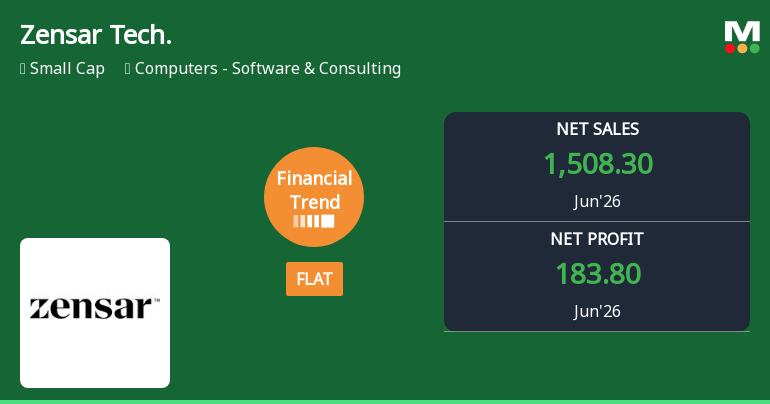
Zensar Technologies Ltd Reports Flat Quarterly Performance Amid Margin Pressures
Zensar Technologies Ltd, a player in the Computers - Software & Consulting sector, has reported a flat financial performance for the quarter ended June 2026, marking a significant shift from its previously positive growth trajectory. Despite achieving record net sales and cash reserves, the company’s overall financial trend has deteriorated, prompting a downgrade in its Mojo Grade from Hold to Sell as of 18 May 2026.
Read full news article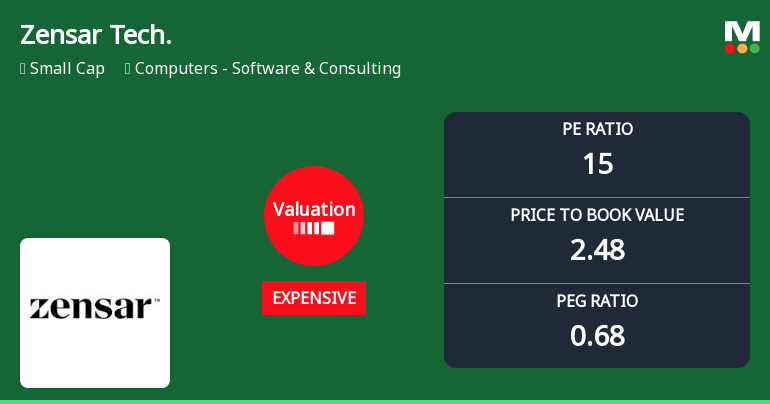
Zensar Technologies Ltd Valuation Shifts Signal Changing Market Perception
Zensar Technologies Ltd has recently undergone a notable shift in its valuation parameters, moving from a fair to an expensive rating. This change reflects evolving market perceptions amid fluctuating price-to-earnings and price-to-book value ratios, prompting investors to reassess the stock’s price attractiveness relative to its historical averages and peer group within the Computers - Software & Consulting sector.
Read full news article
Zensar Technologies Ltd is Rated Hold
Zensar Technologies Ltd is rated 'Hold' by MarketsMOJO, with this rating last updated on 18 May 2026. However, the analysis and financial metrics discussed here reflect the stock's current position as of 24 July 2026, providing investors with an up-to-date view of the company’s fundamentals, returns, and market standing.
Read full news article Announcements
Zensar Technologies Limited - Press Release
22-Nov-2019 | Source : NSEZensar Technologies Limited has informed the Exchange regarding a press release dated November 21, 2019, titled " Zensar featured in the 100 Best Company for Women in 2019 Working Mother & Avtar Best Companies for Women in India and Exemplar of Inclusion in the Working Mother & Avtar Most Inclusive Companies in India (MICI). ".
Zensar Technologies Limited - Press Release
14-Nov-2019 | Source : NSEZensar Technologies Limited has informed the Exchange regarding a press release dated November 13, 2019, titled " Zensar wins the Future of Learning & Development Best Learning Strategy of the Year Award at the 4th Edition L&D Summit and Awards 2019 . ".
Zensar Technologies Limited - Analysts/Institutional Investor Meet/Con. Call Updates
06-Nov-2019 | Source : NSEZensar Technologies Limited has informed the Exchange regarding Analysts/Institutional Investor Meet/Con. Call Updates
Corporate Actions

No Upcoming Board Meetings

Zensar Technologies Ltd has declared 630% dividend, ex-date: 17 Jul 26

Zensar Technologies Ltd has announced 2:10 stock split, ex-date: 07 Sep 18

Zensar Technologies Ltd has announced 1:1 bonus issue, ex-date: 21 Jul 10

No Rights history available
Quality key factors
Valuation key factors
Technicals key factors
 Technical Indicator Scale: Bearish, Mildly Bearish, Sideways, Mildly Bullish, Bullish Turned
 Shareholding Snapshot : Jun 2026
Shareholding Compare (%holding)
Promoters
None
Held by 22 Schemes (19.54%)
Held by 181 FIIs (10.73%)
Swallow Associates Llp (26.63%)
Hdfc Mutual Fund - Hdfc Retirement Savings Fund - (8.81%)
14.08%
Quarterly Results Snapshot (Consolidated) - Jun'26 - YoY

YoY Growth in quarter ended Jun 2026 is 8.90% vs 7.52% in Jun 2025

YoY Growth in quarter ended Jun 2026 is 0.99% vs 15.26% in Jun 2025
Half Yearly Results Snapshot (Consolidated) - Sep'25
Growth in half year ended Sep 2025 is 8.10% vs 5.19% in Sep 2024
Growth in half year ended Sep 2025 is 16.14% vs -4.97% in Sep 2024
Nine Monthly Results Snapshot (Consolidated) - Dec'25
YoY Growth in nine months ended Dec 2025 is 8.04% vs 6.80% in Dec 2024
YoY Growth in nine months ended Dec 2025 is 19.14% vs -3.72% in Dec 2024
Annual Results Snapshot (Consolidated) - Mar'26
YoY Growth in year ended Mar 2026 is 7.70% vs 7.73% in Mar 2025
YoY Growth in year ended Mar 2026 is 19.21% vs -2.29% in Mar 2025
About Zensar Technologies Ltd

Company Coordinates


