
Compare Zim Laboratories with Similar Stocks
Dashboard
Weak Long Term Fundamental Strength with a -15.97% CAGR growth in Operating Profits over the last 5 years
- The company has been able to generate a Return on Equity (avg) of 6.90% signifying low profitability per unit of shareholders funds
The company has declared Negative results for the last 8 consecutive quarters
Despite the size of the company, domestic mutual funds hold only 0% of the company
Stock DNA
Pharmaceuticals & Biotechnology
INR 610 Cr (Micro Cap)
106.00
34
0.00%
0.28
1.98%
2.06
Total Returns (Price + Dividend) 
Latest dividend: 0.5 per share ex-dividend date: Sep-19-2019
Risk Adjusted Returns v/s
Returns Beta

News

Zim Laboratories Ltd is Rated Sell by MarketsMOJO
Zim Laboratories Ltd is rated 'Sell' by MarketsMOJO, with this rating last updated on 05 May 2026. However, the analysis and financial metrics discussed here reflect the stock's current position as of 20 June 2026, providing investors with an up-to-date view of the company’s fundamentals, returns, and market performance.
Read full news article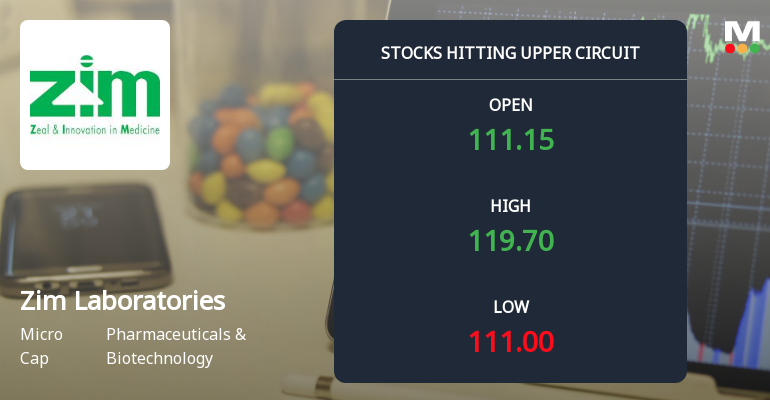
Zim Laboratories Ltd Locks at Upper Circuit With 5.18% Gain — Buyers Queue, Sellers Absent
At Rs 119.66, the buying was done — not because demand dried up, but because the exchange wouldn't let the stock go any higher. Zim Laboratories Ltd locked at its upper circuit of 5.18% on 19 Jun 2026, with buyers queuing and no sellers willing to part with shares.
Read full news article
Zim Laboratories Ltd Locks at Upper Circuit With 4.99% Gain — Buyers Queue, Sellers Absent
At Rs 114.01, the buying was done — not because demand dried up, but because the exchange wouldn't let the stock go any higher. Zim Laboratories Ltd locked at its upper circuit of 4.99% on 18 Jun 2026, with buyers queuing and no sellers willing to part with shares.
Read full news article Announcements
Corporate Actions

No Upcoming Board Meetings

Zim Laboratories Ltd has declared 5% dividend, ex-date: 19 Sep 19

No Splits history available

Zim Laboratories Ltd has announced 2:1 bonus issue, ex-date: 22 Dec 22

No Rights history available
Quality key factors
Valuation key factors
Technicals key factors
 Technical Indicator Scale: Bearish, Mildly Bearish, Sideways, Mildly Bullish, Bullish Turned
 Shareholding Snapshot : Mar 2026
Shareholding Compare (%holding)
Non Institution
None
Held by 0 Schemes
Held by 0 FIIs
Anwar Daud (24.93%)
Elimath Advisors Private Limited (10.44%)
32.77%
Quarterly Results Snapshot (Consolidated) - Mar'26 - YoY

YoY Growth in quarter ended Mar 2026 is -3.18% vs -7.75% in Mar 2025
YoY Growth in quarter ended Mar 2026 is -23.36% vs -39.68% in Mar 2025
Half Yearly Results Snapshot (Consolidated) - Sep'25

Growth in half year ended Sep 2025 is -7.76% vs 13.51% in Sep 2024
Growth in half year ended Sep 2025 is -170.12% vs -25.11% in Sep 2024
Nine Monthly Results Snapshot (Consolidated) - Dec'25
YoY Growth in nine months ended Dec 2025 is -0.43% vs 8.31% in Dec 2024
YoY Growth in nine months ended Dec 2025 is -71.15% vs -20.52% in Dec 2024
Annual Results Snapshot (Consolidated) - Mar'26
YoY Growth in year ended Mar 2026 is -1.22% vs 3.16% in Mar 2025
YoY Growth in year ended Mar 2026 is -52.01% vs -29.45% in Mar 2025
About Zim Laboratories Ltd

Company Coordinates


