
Compare Zota Health Care with Similar Stocks
Dashboard
Weak Long Term Fundamental Strength with a -287.32% CAGR growth in Operating Profits over the last 5 years
- Low ability to service debt as the company has a high Debt to EBITDA ratio of 14.58 times
- The company has been able to generate a Return on Equity (avg) of 1.99% signifying low profitability per unit of shareholders funds
Risky - Negative Operating Profits
Falling Participation by Institutional Investors
Below par performance in long term as well as near term
Stock DNA
Pharmaceuticals & Biotechnology
INR 4,450 Cr (Small Cap)
NA (Loss Making)
34
0.07%
0.25
-9.80%
6.36
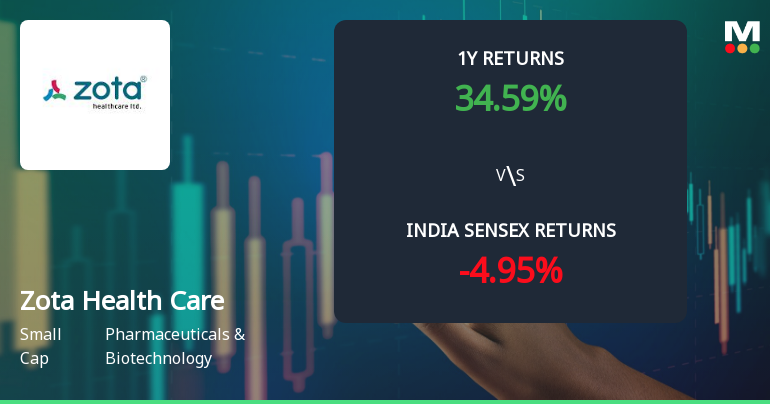
Total Returns (Price + Dividend) 
Latest dividend: 1 per share ex-dividend date: Sep-22-2025
Risk Adjusted Returns v/s
Returns Beta

News
Zota Health Care Ltd Technical Momentum Shifts Amid Mixed Indicator Signals
Zota Health Care Ltd has exhibited a notable shift in its technical momentum, moving from a mildly bearish stance to a sideways trend, reflecting a complex interplay of bullish and bearish signals across key technical indicators. Despite a strong day change of 4.36%, the company’s overall technical profile remains mixed, warranting a cautious approach from investors amid evolving market dynamics.
Read full news article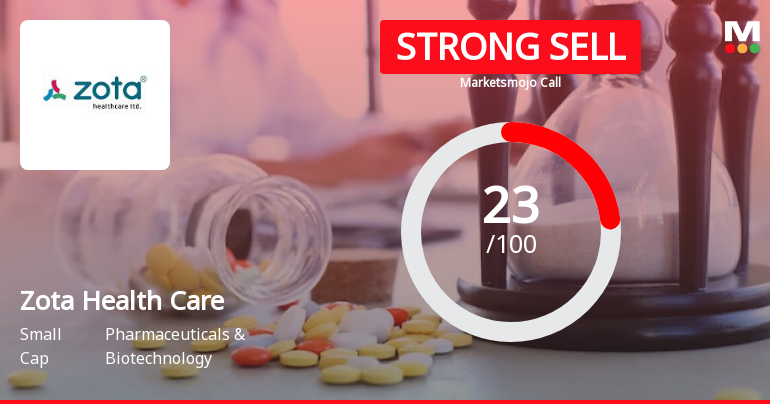
Zota Health Care Ltd is Rated Strong Sell
Zota Health Care Ltd is rated Strong Sell by MarketsMOJO, with this rating last updated on 04 March 2026. However, the analysis and financial metrics discussed here reflect the stock’s current position as of 14 June 2026, providing investors with the latest insights into the company’s performance and outlook.
Read full news article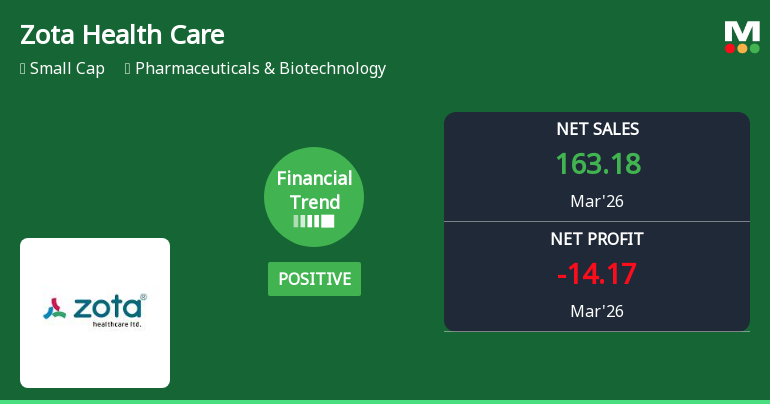
Zota Health Care Ltd Reports Mixed Quarterly Results Amid Financial Trend Shift
Zota Health Care Ltd reported its quarterly results for March 2026, revealing a complex financial picture marked by record net sales and operating profit margins, yet persistent net losses and rising interest expenses. Despite improvements in some key metrics, the company’s overall financial trend has shifted from positive to flat, prompting a downgrade in its Mojo Grade to Strong Sell.
Read full news article Announcements
Zota Health Care LImited - Outcome of Board Meeting
03-Dec-2019 | Source : NSEZota Health Care LImited has informed the Exchange regarding Board meeting held on December 03, 2019.
Zota Health Care LImited - Updates
28-Nov-2019 | Source : NSEZota Health Care LImited has informed the Exchange regarding 'Received product registration licenses for three products from Turkmenistan'.
Zota Health Care LImited - Updates
18-Nov-2019 | Source : NSEZota Health Care LImited has informed the Exchange regarding 'Newspaper Advertisements of Extract of Unaudited Financial Results for the quarter and half year ended September 30, 2019'.
Corporate Actions

No Upcoming Board Meetings

Zota Health Care Ltd has declared 10% dividend, ex-date: 22 Sep 25

No Splits history available

Zota Health Care Ltd has announced 4:10 bonus issue, ex-date: 25 Jul 19

No Rights history available
Quality key factors
Valuation key factors
Technicals key factors
 Technical Indicator Scale: Bearish, Mildly Bearish, Sideways, Mildly Bullish, Bullish Turned
 Shareholding Snapshot : Mar 2026
Shareholding Compare (%holding)
Promoters
0.2573
Held by 1 Schemes (0.37%)
Held by 19 FIIs (8.21%)
Himansubhai Muktilal Zota (9.05%)
Asha Mukul Agrawal (5.14%)
27.84%
Quarterly Results Snapshot (Consolidated) - Mar'26 - YoY

YoY Growth in quarter ended Mar 2026 is 67.76% vs 95.95% in Mar 2025

YoY Growth in quarter ended Mar 2026 is -9.93% vs -86.27% in Mar 2025
Half Yearly Results Snapshot (Consolidated) - Sep'25
Growth in half year ended Sep 2025 is 88.16% vs 47.26% in Sep 2024
Growth in half year ended Sep 2025 is -21.87% vs -453.01% in Sep 2024
Nine Monthly Results Snapshot (Consolidated) - Dec'25
YoY Growth in nine months ended Dec 2025 is 91.87% vs 49.56% in Dec 2024
YoY Growth in nine months ended Dec 2025 is -37.35% vs -485.60% in Dec 2024
Annual Results Snapshot (Consolidated) - Mar'26
YoY Growth in year ended Mar 2026 is 83.86% vs 62.32% in Mar 2025
YoY Growth in year ended Mar 2026 is -31.10% vs -293.03% in Mar 2025
About Zota Health Care Ltd

Company Coordinates


