
Compare Zydus Wellness with Similar Stocks
Dashboard
Strong ability to service debt as the company has a low Debt to EBITDA ratio of 6.28 times
Poor long term growth as Operating profit has grown by an annual rate 2.61% of over the last 5 years
Flat results in Mar 26
With ROCE of 4.1, it has a Expensive valuation with a 2.5 Enterprise value to Capital Employed
High Institutional Holdings at 22.05%
Market Beating performance in long term as well as near term
Total Returns (Price + Dividend) 
Latest dividend: 1.2 per share ex-dividend date: Jul-11-2025
Risk Adjusted Returns v/s
Returns Beta

News
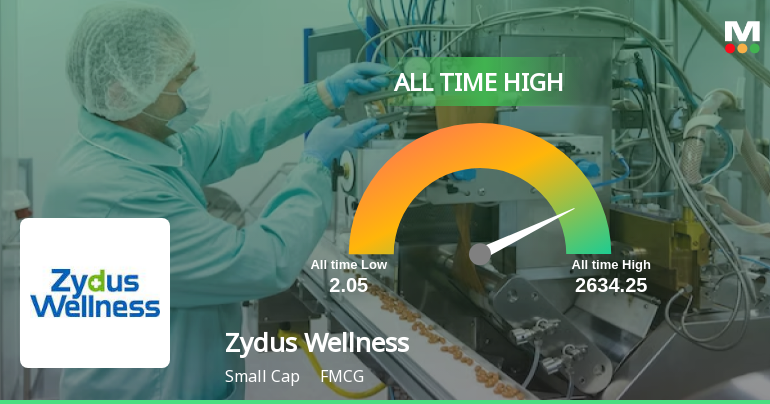
Zydus Wellness Ltd Hits All-Time High of Rs 606.45 as Momentum Builds Across Timeframes
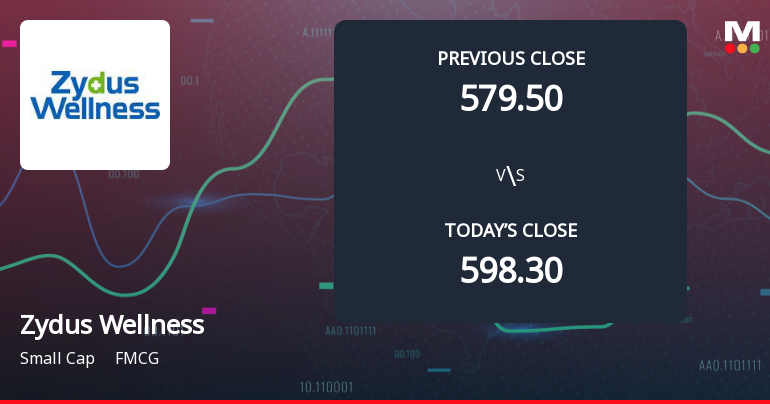
After opening sharply lower by 8.32% to Rs 548.55, Zydus Wellness Ltd staged a robust recovery to close at a new 52-week high of Rs 606.45 on 06 Jul 2026, marking a significant milestone in its price journey.
Read full news article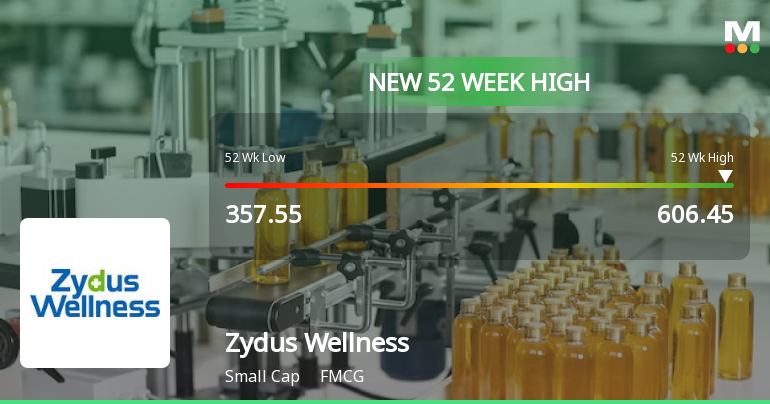
Broad-Based Technical Strength Lifts Zydus Wellness Ltd to 52-Week High of Rs 600.25
Surging past Rs 600.25 on 6 Jul 2026, Zydus Wellness Ltd has reached a fresh 52-week high, marking a remarkable 50.49% gain over the past year compared to the Sensex’s decline of 6.30%. This milestone caps a three-day winning streak that has propelled the stock 5.38% higher, underscoring robust momentum driven by a confluence of bullish technical indicators.
Read full news article Announcements
Zydus Wellness Limited - Other General Purpose
05-Dec-2019 | Source : NSEZydus Wellness Limited has submitted to the Exchange a copy of disclosure of Related Party Transactions on a consolidated basis in the format specified in the accounting standards for the half year ended September 30, 2019.
Zydus Wellness Limited - Outcome of Board Meeting
13-Nov-2019 | Source : NSEZydus Wellness Limited has informed the Exchange regarding Board meeting held on November 13, 2019.
Zydus Wellness Limited - Updates
09-Oct-2019 | Source : NSEZydus Wellness Limited has informed the Exchange regarding 'Certificate under Regulation 74(5) of the SEBI (Depositories and Participants) Regulations, 2018 for the Period ended September 30, 2019'.
Corporate Actions

No Upcoming Board Meetings

Zydus Wellness Ltd has declared 60% dividend, ex-date: 17 Jul 26

Zydus Wellness Ltd has announced 2:10 stock split, ex-date: 18 Sep 25

No Bonus history available

No Rights history available
Quality key factors
Valuation key factors
Technicals key factors
 Technical Indicator Scale: Bearish, Mildly Bearish, Sideways, Mildly Bullish, Bullish Turned
 Shareholding Snapshot : Mar 2026
Shareholding Compare (%holding)
Promoters
None
Held by 22 Schemes (18.43%)
Held by 105 FIIs (3.18%)
Zydus Lifesciences Limited (57.59%)
Parag Parikh Flexi Cap Fund (7.33%)
6.47%
Quarterly Results Snapshot (Consolidated) - Mar'26 - QoQ

QoQ Growth in quarter ended Mar 2026 is 53.87% vs 48.33% in Dec 2025
QoQ Growth in quarter ended Mar 2026 is 506.02% vs 24.43% in Dec 2025
Half Yearly Results Snapshot (Consolidated) - Sep'25

Growth in half year ended Sep 2025 is 13.31% vs 16.80% in Sep 2024
Growth in half year ended Sep 2025 is -55.46% vs 44.97% in Sep 2024
Nine Monthly Results Snapshot (Consolidated) - Dec'25
YoY Growth in nine months ended Dec 2025 is 37.89% vs 16.22% in Dec 2024
YoY Growth in nine months ended Dec 2025 is -79.89% vs 50.09% in Dec 2024
Annual Results Snapshot (Consolidated) - Mar'26
YoY Growth in year ended Mar 2026 is 46.22% vs 16.37% in Mar 2025
YoY Growth in year ended Mar 2026 is -43.15% vs 29.97% in Mar 2025
About Zydus Wellness Ltd

Company Coordinates


