
Compare Blue Cloud Soft. with Similar Stocks
Dashboard
Healthy long term growth as Net Sales has grown by an annual rate of 41.20% and Operating profit at 93.14%
The company has declared Positive results for the last 13 consecutive quarters
With ROCE of 8.3, it has a Fair valuation with a 1.9 Enterprise value to Capital Employed
Despite the size of the company, domestic mutual funds hold only 0% of the company
Below par performance in long term as well as near term
Stock DNA
Software Products
INR 2,030 Cr (Micro Cap)
32.00
20
0.00%
0.29
6.55%
2.34
Total Returns (Price + Dividend) 
Latest dividend: 0.02 per share ex-dividend date: Oct-11-2024
Risk Adjusted Returns v/s
Returns Beta

News

Blue Cloud Softech Solutions Ltd Upgraded to Hold on Technical and Valuation Improvements
Blue Cloud Softech Solutions Ltd has seen its investment rating upgraded from Sell to Hold, reflecting a notable shift in technical indicators and valuation metrics. Despite recent price volatility and a challenging long-term return profile, the company’s improving financial trends and stabilising technical outlook have prompted a reassessment of its market stance.
Read full news article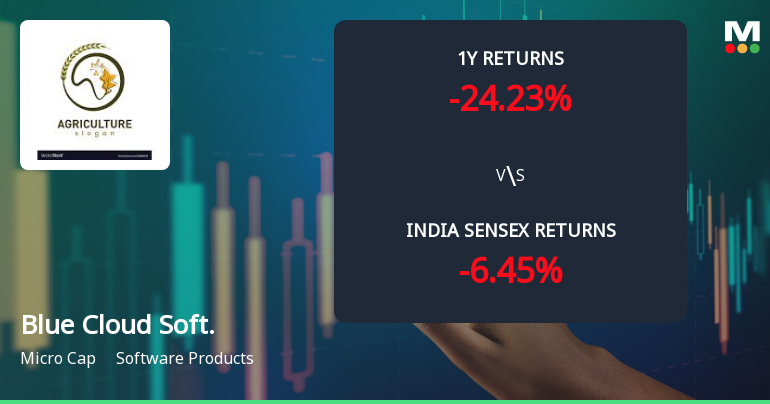
Blue Cloud Softech Solutions Ltd Sees Technical Momentum Shift Amid Volatile Market Moves
Blue Cloud Softech Solutions Ltd has experienced a notable shift in price momentum, reflected in a 19.82% surge in its share price to ₹21.64 on 23 Jun 2026. Despite this sharp daily gain, the company’s technical indicators present a complex picture, with mixed signals across weekly and monthly timeframes, prompting a reassessment of its market stance amid a downgrade to a Sell rating by MarketsMOJO.
Read full news article
Blue Cloud Softech Solutions Ltd Faces Bearish Momentum Amid Technical Downgrade
Blue Cloud Softech Solutions Ltd, a micro-cap player in the Software Products sector, has experienced a notable shift in its technical momentum, prompting a downgrade in its MarketsMOJO grade from Hold to Sell as of 17 Nov 2025. The stock’s recent price action and technical indicators suggest increasing bearish pressure, raising concerns for investors amid a challenging market backdrop.
Read full news article Announcements
Disclosures under Reg. 29(1) of SEBI (SAST) Regulations 2011
24-Jun-2026 | Source : BSEThe Exchange has received the disclosure under Regulation 29(1) of SEBI (Substantial Acquisition of Shares & Takeovers) Regulations 2011 for ConnectM Technology Solutions Inc.
Disclosures under Reg. 29(1) of SEBI (SAST) Regulations 2011
23-Jun-2026 | Source : BSEThe Exchange has received the disclosure under Regulation 29(1) of SEBI (Substantial Acquisition of Shares & Takeovers) Regulations 2011 for AstraBridge Inc.
Announcement under Regulation 30 (LODR)-Press Release / Media Release
22-Jun-2026 | Source : BSEDisclosure under Regulation 30 of the SEBI (Listing Obligations and Disclosure Requirements) Regulations 2015 - Press Release titled Exploring Business Opportunities in Artificial Intelligence Technology.
Corporate Actions

No Upcoming Board Meetings

Blue Cloud Softech Solutions Ltd has declared 1% dividend, ex-date: 11 Oct 24

Blue Cloud Softech Solutions Ltd has announced 1:2 stock split, ex-date: 20 Jan 25

No Bonus history available

No Rights history available
Quality key factors
Valuation key factors
Technicals key factors
 Technical Indicator Scale: Bearish, Mildly Bearish, Sideways, Mildly Bullish, Bullish Turned
 Shareholding Snapshot : Mar 2026
Shareholding Compare (%holding)
Non Institution
None
Held by 0 Schemes
Held by 3 FIIs (13.29%)
Yarlagadda Janaki (38.06%)
Siraj Holding Llc (23.33%)
13.16%
Quarterly Results Snapshot (Consolidated) - Mar'26 - QoQ

QoQ Growth in quarter ended Mar 2026 is 4.56% vs 4.94% in Dec 2025
QoQ Growth in quarter ended Mar 2026 is -34.82% vs 20.49% in Dec 2025
Half Yearly Results Snapshot (Consolidated) - Sep'25
Growth in half year ended Sep 2025 is -1.62% vs 284.37% in Sep 2024
Growth in half year ended Sep 2025 is 36.56% vs 536.44% in Sep 2024
Nine Monthly Results Snapshot (Consolidated) - Dec'25
YoY Growth in nine months ended Dec 2025 is 18.13% vs 112.12% in Dec 2024
YoY Growth in nine months ended Dec 2025 is 54.95% vs 316.40% in Dec 2024
Annual Results Snapshot (Consolidated) - Mar'26
YoY Growth in year ended Mar 2026 is 25.73% vs 58.68% in Mar 2025
YoY Growth in year ended Mar 2026 is 36.66% vs 175.31% in Mar 2025
About Blue Cloud Softech Solutions Ltd

Company Coordinates


