
Compare Ramco Systems with Similar Stocks
Dashboard
Weak Long Term Fundamental Strength with a -8.05% CAGR growth in Operating Profits over the last 5 years
- Company's ability to service its debt is weak with a poor EBIT to Interest (avg) ratio of -12.71
- The company has been able to generate a Return on Equity (avg) of 3.62% signifying low profitability per unit of shareholders funds
With a growth in Net Profit of 401.6%, the company declared Very Positive results in Mar 26
With ROE of 18.1, it has a Very Expensive valuation with a 9 Price to Book Value
Rising Promoter Confidence
Stock DNA
Software Products
INR 3,136 Cr (Small Cap)
50.00
20
0.00%
-0.24
18.10%
8.97
Total Returns (Price + Dividend) 
Ramco Systems for the last several years.
Risk Adjusted Returns v/s
Returns Beta

News
Ramco Systems Ltd Upgraded to Hold on Improved Technicals and Financial Performance
Ramco Systems Ltd, a small-cap player in the software products sector, has seen its investment rating upgraded from Sell to Hold as of 7 July 2026. This change reflects a marked improvement in the company’s technical indicators, alongside robust quarterly financial results and rising promoter confidence, despite some lingering concerns over long-term fundamentals and valuation metrics.
Read full news article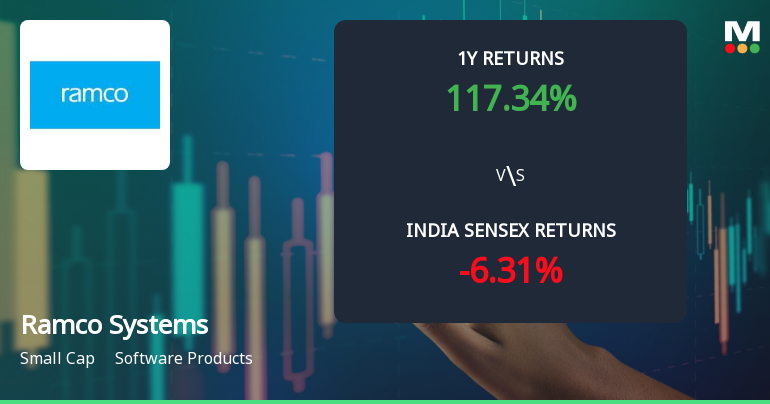
Ramco Systems Ltd Technical Momentum Shifts Signal Bullish Outlook Amid Mixed Indicators
Ramco Systems Ltd has witnessed a notable shift in its technical momentum, moving from a mildly bullish stance to a more confident bullish trend. Despite a slight dip in the daily price, key technical indicators such as MACD, moving averages, and Bollinger Bands suggest strengthening upward momentum, while some oscillators like RSI remain cautious. This nuanced technical picture offers investors a comprehensive view of the stock’s evolving market dynamics.
Read full news article
Golden Cross Confirmed: Do Ramco Systems Ltd's Other Technical Indicators Agree?
The 50-day moving average has crossed above the 200-day moving average for Ramco Systems Ltd on 07 Jul 2026, signalling a golden cross. While this technical event often suggests a shift towards bullish momentum, the broader technical and fundamental context presents a nuanced picture that warrants careful analysis.
Read full news article Announcements
Ramco Systems Limited - Analysts/Institutional Investor Meet/Con. Call Updates
04-Nov-2019 | Source : NSERamco Systems Limited has informed the Exchange regarding Analysts/Institutional Investor Meet/Con. Call Updates
Ramco Systems Limited - Updates
31-Oct-2019 | Source : NSERamco Systems Limited has informed the Exchange regarding 'News paper publication format of Unaudited Financial Results for the quarter and Half year ended 30.09.2019'.
Ramco Systems Limited - ESOP/ESOS/ESPS
30-Oct-2019 | Source : NSERamco Systems Limited has informed the Exchange regarding Grant of 25000 Options.
Corporate Actions

No Upcoming Board Meetings

No Dividend history available

No Splits history available

No Bonus history available

Ramco Systems Ltd has announced 1:2 rights issue, ex-date: 22 Apr 14
Quality key factors
Valuation key factors
Technicals key factors
 Technical Indicator Scale: Bearish, Mildly Bearish, Sideways, Mildly Bullish, Bullish Turned
 Shareholding Snapshot : Mar 2026
Shareholding Compare (%holding)
Promoters
None
Held by 3 Schemes (1.79%)
Held by 38 FIIs (10.02%)
Ramco Industries Limited (18.98%)
Vanderbilt University - Atyant Capital Management Limited (3.65%)
26.46%
Quarterly Results Snapshot (Consolidated) - Mar'26 - YoY

YoY Growth in quarter ended Mar 2026 is 19.39% vs 18.34% in Mar 2025
YoY Growth in quarter ended Mar 2026 is 371.75% vs 123.08% in Mar 2025
Half Yearly Results Snapshot (Consolidated) - Sep'25
Growth in half year ended Sep 2025 is 20.61% vs 4.93% in Sep 2024
Growth in half year ended Sep 2025 is 146.04% vs 84.74% in Sep 2024
Nine Monthly Results Snapshot (Consolidated) - Dec'25
YoY Growth in nine months ended Dec 2025 is 18.23% vs 10.50% in Dec 2024
YoY Growth in nine months ended Dec 2025 is 142.44% vs 81.93% in Dec 2024
Annual Results Snapshot (Consolidated) - Mar'26
YoY Growth in year ended Mar 2026 is 18.54% vs 12.46% in Mar 2025
YoY Growth in year ended Mar 2026 is 222.16% vs 85.84% in Mar 2025
About Ramco Systems Ltd

Company Coordinates


