
Compare Dollar Industrie with Similar Stocks
Stock DNA
Garments & Apparels
INR 1,594 Cr (Small Cap)
14.00
24
1.15%
0.31
11.32%
1.56
Total Returns (Price + Dividend) 
Latest dividend: 3 per share ex-dividend date: Jul-18-2025
Risk Adjusted Returns v/s
Returns Beta

News

Dollar Industries Ltd Surges 7.27% to Day's High of Rs 284.15 — Outperforms Sector by 6.26 Percentage Points
The Sensex edged down marginally by 0.02% on 29 Jun 2026, while Dollar Industries Ltd surged 7.27% to touch an intraday high of Rs 284.15. This 6.26 percentage-point outperformance over its Garments & Apparels sector peers highlights a distinctly stock-specific rally rather than a broad market lift.
Read full news article
Dollar Industries Ltd is Rated Sell
Dollar Industries Ltd is rated Sell by MarketsMOJO, with this rating last updated on 05 Jan 2026. However, the analysis and financial metrics discussed here reflect the stock's current position as of 21 June 2026, providing investors with an up-to-date perspective on the company’s performance and outlook.
Read full news article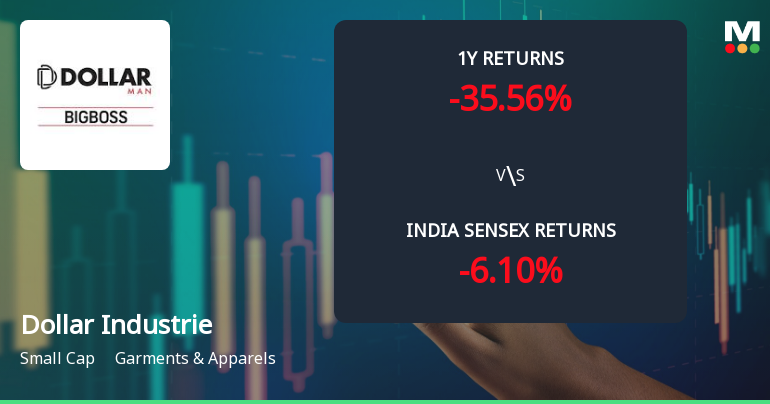
Dollar Industries Ltd Technical Momentum Shifts Amid Prolonged Downtrend
Dollar Industries Ltd, a small-cap player in the Garments & Apparels sector, has experienced a subtle shift in its technical momentum, moving from a bearish to a mildly bearish trend. Despite this slight improvement, key technical indicators continue to signal caution for investors, reflecting ongoing challenges in price momentum and market sentiment.
Read full news article Announcements
Disclosures under Reg. 29(2) of SEBI (SAST) Regulations 2011
25-Jun-2026 | Source : BSEThe Exchange has received the disclosure under Regulation 29(2) of SEBI (Substantial Acquisition of Shares & Takeovers) Regulations 2011 for V K Mercantile Pvt Ltd
Closure of Trading Window
23-Jun-2026 | Source : BSEPlease find enclosed Notice of closure of Trading Window
Announcement under Regulation 30 (LODR)-Newspaper Publication
20-Jun-2026 | Source : BSENewspaper Publication of Notice of Meeting to Equity Shareholder and Unsecured Creditor in connection with the Composite Scheme of Arrangement
Corporate Actions

No Upcoming Board Meetings

Dollar Industries Ltd has declared 150% dividend, ex-date: 28 Jul 26

Dollar Industries Ltd has announced 2:10 stock split, ex-date: 31 Aug 17

No Bonus history available

No Rights history available
Quality key factors
Valuation key factors
Technicals key factors
 Technical Indicator Scale: Bearish, Mildly Bearish, Sideways, Mildly Bullish, Bullish Turned
 Shareholding Snapshot : Mar 2026
Shareholding Compare (%holding)
Promoters
None
Held by 1 Schemes (0.0%)
Held by 28 FIIs (4.98%)
Dollar Holdings Private Limited (46.28%)
Fidelity Funds - Asian Smaller Companies (3.18%)
13.09%
Quarterly Results Snapshot (Consolidated) - Mar'26 - YoY

YoY Growth in quarter ended Mar 2026 is 13.19% vs 9.83% in Mar 2025
YoY Growth in quarter ended Mar 2026 is 11.38% vs -11.60% in Mar 2025
Half Yearly Results Snapshot (Consolidated) - Sep'25
Growth in half year ended Sep 2025 is 11.58% vs 5.38% in Sep 2024
Growth in half year ended Sep 2025 is 35.08% vs 6.14% in Sep 2024
Nine Monthly Results Snapshot (Consolidated) - Dec'25
YoY Growth in nine months ended Dec 2025 is 8.44% vs 8.30% in Dec 2024
YoY Growth in nine months ended Dec 2025 is 21.14% vs 8.19% in Dec 2024
Annual Results Snapshot (Consolidated) - Mar'26
YoY Growth in year ended Mar 2026 is 9.97% vs 8.79% in Mar 2025
YoY Growth in year ended Mar 2026 is 18.00% vs 0.93% in Mar 2025
About Dollar Industries Ltd

Company Coordinates


