Nitin Spinners

  • Market Cap: Small Cap
  • Industry: Garments & Apparels
  • ISIN: INE229H01012
  • NSEID: NITINSPIN
  • BSEID: 532698
INR
357.60
4.05 (1.15%)
BSENSE

Mar 24

BSE+NSE Vol: 2.03 lacs

  • Price Points
  • Score
  • Mojo Parameters
  • Total Return
  • News and Corporate Actions
  • Key factors
  • Shareholding
  • Financials
  • CompanyCV
stock-summaryPrice Point
High/Low

1Day

52 Week

Valuation
Technical
Day's Volume

CASH

2.03 lacs (100.98%) Volume

Shareholding (Dec 2025)

FII

0.92%

Held by 35 FIIs

DII

0.02%

Held by 15 DIIs

Promoter

56.71%

Who are in the management team of Nitin Spinners?

06-Jun-2025

As of March 2023, the management team of Nitin Spinners includes Dinesh Nolkha (Managing Director), Nitin Nolakha (Joint Managing Director), Sudhir Garg (Vice President & Company Secretary), and three Independent Directors: R Chattopadhyay, Aditi Mehta, and Rohit Swadheen Mehta.

As of March 2023, the management team of Nitin Spinners includes the following individuals:<BR><BR>1. Dinesh Nolkha - Managing Director<BR>2. Nitin Nolakha - Joint Managing Director<BR>3. Sudhir Garg - Vice President & Company Secretary<BR>4. R Chattopadhyay - Independent Director<BR>5. Aditi Mehta - Independent Director<BR>6. Rohit Swadheen Mehta - Independent Director<BR><BR>These members play key roles in the company's leadership and governance.

View full answer

What does Nitin Spinners do?

06-Jun-2025

Nitin Spinners Ltd manufactures 100% cotton yarns and fabrics in the garments industry and is categorized as a small-cap company. As of March 2025, it reported net sales of ₹841 crore and a net profit of ₹46 crore, with a market cap of ₹2,227 crore.

Overview:<BR>Nitin Spinners Ltd is a company engaged in the manufacturing of 100% Cotton Yarns and Fabrics, operating within the Garments & Apparels industry and categorized as a Small Cap.<BR><BR>History:<BR>Nitin Spinners Ltd was incorporated on 15th October 1992 as a private limited company and was converted into a public limited company on November 15, 1994. The latest quarterly results reported net sales and net profit for the period ending March 2025.<BR><BR>Financial Snapshot:<BR>- Net Sales: 841 Cr (Quarterly Results - Mar 2025)<BR>- Net Profit: 46 Cr (Quarterly Results - Mar 2025)<BR>- Market Cap: Rs 2,227 Cr (Small Cap)<BR><BR>Key Metrics:<BR>- P/E: 13.00<BR>- Industry P/E: 23<BR>- Dividend Yield: 0.63%<BR>- Debt Equity: 0.88<BR>- Return on Equity: 13.38%<BR>- Price to Book: 1.71<BR><BR>Contact Details:<BR>Address: 16-17 KM Stone, Chittor Highway Hamirgarh Bhilwara Rajasthan : 311025<BR>Tel: 91-1482-286110-113<BR>Email: nsl@nitinspinners.com<BR>Website: http://www.nitinspinners.com

View full answer

Has Nitin Spinners declared dividend?

06-Jun-2025

Yes, Nitin Spinners Ltd has declared a 25% dividend, amounting to ₹2.5 per share, with an ex-date of September 9, 2024. The company has shown strong long-term total returns, particularly a total return of over 1000% in the last 5 years.

Nitin Spinners Ltd has declared a 25% dividend.<BR><BR>Dividend Details:<BR>- Percentage announced: 25%<BR>- Amount per share: 2.5<BR>- Ex-date: 09 Sep 24<BR><BR>Dividend Yield: 0.63%.<BR><BR>Total Returns by Period:<BR>In the last 6 months, the price return was -12.39%, with no dividend return, resulting in a total return of -12.39%.<BR><BR>Over the past year, the price return was 21.5%, with a dividend return of 0.75%, leading to a total return of 22.25%.<BR><BR>In the 2-year period, the price return was 44.23%, with a dividend return of 1.85%, culminating in a total return of 46.08%.<BR><BR>For the 3-year period, the price return was 69.62%, with a dividend return of 3.93%, resulting in a total return of 73.55%.<BR><BR>In the last 4 years, the price return was 239.09%, with a dividend return of 7.44%, leading to a total return of 246.53%.<BR><BR>Over the last 5 years, the price return was 1001.81%, with a dividend return of 27.61%, resulting in a total return of 1029.42%.<BR><BR>Overall, Nitin Spinners has declared a dividend, which contributes positively to its long-term total returns, particularly evident over the 5-year period where the total return exceeded 1000%. The recent performance indicates fluctuations in shorter periods, but the longer-term outlook remains strong.

View full answer

Who are the peers of the Nitin Spinners?

03-Jun-2025

Nitin Spinners' peers include Trent, Page Industries, K P R Mill Ltd, Vedant Fashions, Trident, Shankara Build., SP Apparels, Sangam India, and Sai Silks. In terms of performance, Nitin Spinners has a 1-year return of 24.57%, with excellent management risk and average capital structure compared to its peers.

Peers: The peers of Nitin Spinners are Trent, Page Industries, K P R Mill Ltd, Vedant Fashions, Trident, Shankara Build., SP Apparels, Sangam India, and Sai Silks.<BR><BR>Quality Snapshot: Excellent management risk is observed at Page Industries, K P R Mill Ltd, and Vedant Fashions, while Good management risk is found at Trent, Nitin Spinners, SP Apparels, and the rest. Average management risk is noted at Trident, Shankara Build., Sangam India, Sai Silks, and Cantabil Retail. In terms of Growth, Excellent growth is seen at Sai Silks, while Good growth is found at K P R Mill Ltd, Nitin Spinners, and the rest. Below Average growth is noted at Page Industries, Vedant Fashions, Trident, SP Apparels, Sangam India, and the rest. For Capital Structure, Excellent capital structure is observed at Page Industries, K P R Mill Ltd, and Vedant Fashions, while Average capital structure is found at Nitin Spinners, and Good capital structure is noted at Trent, Trident, Shankara Build., SP Apparels, Sai Silks, and the rest.<BR><BR>Return Snapshot: The peer with the highest 1-year return is Page Industries at 26.58%, while Vedant Fashions has the lowest at -24.55%. Nitin Spinners has a 1-year return of 24.57%, which is lower than Page Industries but higher than Vedant Fashions. Additionally, Vedant Fashions, Trident, and Sai Silks have negative six-month returns.

View full answer

Who are the top shareholders of the Nitin Spinners?

17-Jul-2025

The top shareholders of Nitin Spinners include Redial Trading And Investment Private Limited with 32.09%, mutual funds with 15.42%, and individual investors holding 22.01%. Bandhan Small Cap Fund is the largest public shareholder at 5.14%, with no pledged promoter holdings reported.

The top shareholders of Nitin Spinners include several key players. The majority shareholders are the promoters, with Redial Trading And Investment Private Limited holding the highest stake at 32.09%. Additionally, mutual funds collectively hold 15.42% through five different schemes. Among public shareholders, Bandhan Small Cap Fund is the largest, with a holding of 5.14%. Individual investors also have a significant presence, owning 22.01% of the company. Notably, there are no pledged promoter holdings reported.

View full answer

How big is Nitin Spinners?

24-Jul-2025

As of 24th July, Nitin Spinners Ltd has a market capitalization of 2,206.00 Cr, with recent net sales of 3,305.65 Cr and a net profit of 175.43 Cr. Shareholder's funds are 1,146.33 Cr and total assets amount to 2,716.65 Cr as of March 2024.

As of 24th July, Nitin Spinners Ltd has a market capitalization of 2,206.00 Cr, categorizing it as a Small Cap company.<BR><BR>In the latest 4 quarters, Nitin Spinners reported Net Sales of 3,305.65 Cr and a Net Profit of 175.43 Cr.<BR><BR>The latest annual period for the balance sheet is March 2024, with Shareholder's Funds amounting to 1,146.33 Cr and Total Assets of 2,716.65 Cr.

View full answer

How has been the historical performance of Nitin Spinners?

04-Nov-2025

Nitin Spinners has experienced significant growth in net sales, rising from 1,242.51 Cr in Mar'19 to 3,305.65 Cr in Mar'25, with profit after tax increasing from 64.11 Cr to 175.43 Cr during the same period, despite fluctuations in operating profit and profit margins. Total assets have also grown substantially, indicating a robust overall performance.

Answer:<BR>The historical performance of Nitin Spinners shows a significant growth trajectory in net sales and profitability over the years.<BR><BR>Breakdown:<BR>Nitin Spinners has demonstrated a strong upward trend in net sales, increasing from 1,242.51 Cr in Mar'19 to 3,305.65 Cr in Mar'25. This growth is accompanied by fluctuations in operating profit, which peaked at 653.62 Cr in Mar'22 but has since decreased to 475.02 Cr in Mar'25. The profit before tax also reflects this trend, rising from 97.30 Cr in Mar'19 to 236.94 Cr in Mar'25, despite a notable high of 506.17 Cr in Mar'22. Profit after tax has shown resilience, increasing from 64.11 Cr in Mar'19 to 175.43 Cr in Mar'25, although it was significantly higher at 326.14 Cr in Mar'22. The company's total assets have grown from 1,645.26 Cr in Mar'20 to 2,732.32 Cr in Mar'25, while total liabilities have also risen, reaching 1,164.71 Cr in Mar'25. Cash flow from operating activities has improved, reaching 307.00 Cr in Mar'25, compared to 98.00 Cr in Mar'20. Overall, Nitin Spinners has shown a robust growth pattern in sales and profitability, despite some fluctuations in profit margins and expenses.

View full answer

Is Nitin Spinners overvalued or undervalued?

07-Nov-2025

As of November 6, 2025, Nitin Spinners is considered very attractive and undervalued with a PE ratio of 10.41, a Price to Book Value of 0.13, and a PEG ratio of 1.38, despite a year-to-date decline of 31.21%, indicating strong long-term growth potential and a compelling investment opportunity.

As of 6 November 2025, the valuation grade for Nitin Spinners has moved from attractive to very attractive, indicating a significant improvement in its perceived value. The company is currently considered undervalued, with a PE ratio of 10.41, a Price to Book Value of 0.13, and an EV to EBITDA of 13.19. These ratios suggest that Nitin Spinners is trading at a discount compared to its peers, particularly when compared to K P R Mill Ltd, which has a PE ratio of 43.81, and Trident, which has a PE ratio of 32.8.<BR><BR>In the context of its industry, Nitin Spinners stands out with a PEG ratio of 1.38, which is more favorable than K P R Mill Ltd's PEG of 12.41, indicating better growth prospects relative to its valuation. Despite recent stock performance showing a decline of 31.21% year-to-date compared to a 6.62% increase in the Sensex, the long-term outlook remains positive, with a remarkable 544.17% return over the past five years. This reinforces the notion that Nitin Spinners is undervalued and presents a compelling investment opportunity.

View full answer

Is Nitin Spinners technically bullish or bearish?

03-Dec-2025

As of December 2, 2025, Nitin Spinners shows a bearish trend with moderate strength, driven by bearish daily moving averages, Bollinger Bands, and mixed signals from MACD, KST, and OBV.

As of 2 December 2025, the technical trend has changed from mildly bearish to bearish. The current stance is bearish with moderate strength. Key indicators driving this include the daily moving averages, which are bearish, and the Bollinger Bands showing bearish signals on both weekly and monthly time frames. The MACD is mildly bullish on the weekly but mildly bearish on the monthly, indicating mixed signals. Additionally, the KST and OBV are both mildly bearish on the weekly, further supporting the bearish outlook. Overall, the combination of these indicators suggests a bearish sentiment in the market for Nitin Spinners.

View full answer

When is the next results date for Nitin Spinners Ltd?

23-Jan-2026

The next results date for Nitin Spinners Ltd is January 31, 2026.

The next results date for Nitin Spinners Ltd is scheduled for January 31, 2026.

View full answer

Are Nitin Spinners Ltd latest results good or bad?

31-Jan-2026

Nitin Spinners Ltd's latest results show a mixed performance, with a 27.66% increase in net profit quarter-on-quarter but a 0.83% decline year-on-year, alongside a 4.55% drop in revenue compared to last year. While there are signs of recovery, ongoing challenges in the textile sector suggest a cautious outlook for investors.

Nitin Spinners Ltd's latest results present a mixed picture. On the positive side, the company reported a net profit of ₹44.41 crore for Q3 FY26, which is a significant increase of 27.66% compared to the previous quarter. Additionally, revenue grew by 5.34% quarter-on-quarter to ₹800.68 crore, indicating some recovery in demand.<BR><BR>However, when looking at year-on-year performance, there are challenges. The net profit reflects a slight decline of 0.83% compared to the same quarter last year, and revenue is down 4.55% year-on-year. This suggests that while there is sequential improvement, the company is still facing pressures in the broader textile sector, which has been struggling with demand issues.<BR><BR>The operating margin improved to 13.93%, up 83 basis points from the previous quarter, and the PAT margin also expanded to 5.55%, indicating better cost management and operational efficiency. Despite these improvements, the overall context remains challenging, with the stock down 15.35% over the past year, reflecting broader industry headwinds.<BR><BR>In summary, while there are positive signs of recovery in the latest results, the year-on-year declines and ongoing sector challenges indicate that the situation is still precarious. Investors may view the results as cautiously optimistic, but the underlying pressures in the textile industry cannot be overlooked.

View full answer

Should I buy, sell or hold Nitin Spinners Ltd?

01-Feb-2026

Why is Nitin Spinners Ltd falling/rising?

17-Mar-2026

As of 17-Mar, Nitin Spinners Ltd's stock price is rising to 374.75, reflecting a 5.65% increase due to a trend reversal and strong relative performance against the sector. The stock has shown positive returns over various periods, significantly outperforming the benchmark Sensex.

As of 17-Mar, Nitin Spinners Ltd's stock price is rising, currently at 374.75, reflecting a change of 20.05 or 5.65% increase. This upward movement can be attributed to several factors. Firstly, the stock has shown a trend reversal, gaining after three consecutive days of decline, indicating a potential recovery in investor sentiment. Additionally, it has outperformed the sector by 4.89% today, suggesting strong relative performance.<BR><BR>The stock's performance over various periods also highlights its strength; it has increased by 4.56% over the past week and 9.58% over the past month, while the benchmark Sensex has declined by 2.73% and 8.84%, respectively. Year-to-date, Nitin Spinners has delivered a return of 19.14%, significantly outperforming the Sensex, which is down 10.74%.<BR><BR>Moreover, the stock is trading above its moving averages across multiple time frames, indicating a bullish trend. Despite a recent drop in investor participation, with delivery volume falling by 54.29% against the 5-day average, the stock remains liquid enough for trading, which may attract new investors looking for opportunities.<BR><BR>Overall, the combination of positive short-term performance, a trend reversal, and strong long-term returns compared to the market supports the rise in Nitin Spinners Ltd's stock price.

View full answer

Why is Nitin Spinners Ltd falling/rising?

18-Mar-2026

As of 18-Mar, Nitin Spinners Ltd's stock price is at 370.40, down 1.16%. Despite this short-term decline, the stock has shown strong long-term performance, trading above key moving averages and benefiting from increased investor interest, indicating a positive outlook.

As of 18-Mar, Nitin Spinners Ltd's stock price is currently at 370.40, reflecting a decrease of 4.35 (-1.16%). Despite this decline, the stock has shown strong performance over various periods, with a 1-week increase of 2.67%, a 1-month increase of 9.18%, and a year-to-date rise of 17.76%. This indicates that while the stock is experiencing a short-term drop, it has been on an upward trajectory in the longer term.<BR><BR>The stock is trading above its 5-day, 20-day, 50-day, 100-day, and 200-day moving averages, suggesting a generally positive trend. Additionally, the textile sector has gained by 2.82%, indicating that the broader market context is favorable. However, Nitin Spinners has underperformed its sector by 3.95% today, which may contribute to the current price decline.<BR><BR>Investor participation has increased, with a delivery volume of 68.25k on March 17, rising by 39.69% compared to the 5-day average, which could indicate growing interest despite the current price drop. The company's high management efficiency, reflected in a return on capital employed (ROCE) of 18.10%, and its attractive valuation compared to peers, further support the stock's long-term potential.<BR><BR>In summary, while Nitin Spinners Ltd is experiencing a short-term decline in stock price, the overall performance metrics and market conditions suggest a strong long-term outlook, which may explain the mixed sentiment among investors.

View full answer

Why is Nitin Spinners Ltd falling/rising?

19-Mar-2026

As of 19-Mar, Nitin Spinners Ltd's stock price is falling, currently at 362.10, reflecting a 2.61% decrease. This decline is part of a broader trend, with reduced investor participation and a recent drop in profits contributing to the downward pressure on the stock.

As of 19-Mar, Nitin Spinners Ltd's stock price is falling, currently at 362.10, which reflects a decrease of 9.7 points or 2.61%. This decline is part of a broader trend, as the stock has been losing value for the past two days, with a total drop of 3.38% during this period. Additionally, the stock's performance today is in line with the overall sector, which has also seen a decline of 2.78%.<BR><BR>Investor participation appears to be waning, as evidenced by a significant drop in delivery volume, which fell by 31.1% compared to the five-day average. This reduced activity may indicate a lack of confidence among investors. Despite the stock's long-term performance being strong, with a 66.48% increase over three years and a 331.59% rise over five years, the recent short-term performance shows a 4.22% decline over the past month, which could be contributing to the current downward pressure on the stock price.<BR><BR>Moreover, while the stock is trading at a discount compared to its peers and has high management efficiency with a return on capital employed (ROCE) of 18.10%, the recent fall in profits by 1% over the past year may also be impacting investor sentiment negatively. Overall, these factors combined suggest that Nitin Spinners Ltd is currently experiencing a decline in its stock price.

View full answer

Why is Nitin Spinners Ltd falling/rising?

20-Mar-2026

As of 20-Mar, Nitin Spinners Ltd's stock price is rising, currently at 365.35, reflecting a 0.83% increase. The stock has shown strong long-term growth and is trading at a discount compared to peers, contributing to its upward trend despite a recent drop in investor participation.

As of 20-Mar, Nitin Spinners Ltd's stock price is rising, currently at 365.35, reflecting a change of 3.0 (0.83%) upward. The stock has shown a trend reversal, gaining after two consecutive days of decline. Additionally, it outperformed the sector by 0.98% today and reached an intraday high of Rs 374.5, which is a 3.35% increase. <BR><BR>In terms of performance metrics, the stock has demonstrated strong long-term growth, with a 70.92% increase over the past three years and a 335.46% rise over the last five years. Year-to-date, it has increased by 16.15%, contrasting sharply with the Sensex, which has declined by 12.54% during the same period. <BR><BR>Despite a recent drop in investor participation, as indicated by a 23.69% decrease in delivery volume compared to the five-day average, the stock's overall performance remains robust. It is trading at a discount compared to its peers' average historical valuations, supported by high management efficiency with a return on capital employed (ROCE) of 18.10%. <BR><BR>Overall, the combination of a recent price increase, strong long-term performance, and attractive valuation compared to peers contributes to the rising trend of Nitin Spinners Ltd's stock price.

View full answer
iScoreScore
Click here to find our call on this stock
Strong Sell
Sell
Hold
Buy
Strong Buy

Dashboard

1

High Management Efficiency with a high ROCE of 18.10%

 
2

Flat results in Dec 25

 
3

With ROCE of 13.2, it has a Attractive valuation with a 1.3 Enterprise value to Capital Employed

4

Falling Participation by Institutional Investors

5

Market Beating performance in long term as well as near term

stock-summaryMojo Parameters

Mojo Parameters

Loading Valuation Snapshot...

Stock DNA

stock-summary
Industry

Garments & Apparels

stock-summary
Market cap

INR 2,038 Cr (Small Cap)

stock-summary
P/E

12.00

stock-summary
Industry P/E

20

stock-summary
Dividend Yield

0.85%

stock-summary
Debt Equity

0.66

stock-summary
Return on Equity

12.16%

stock-summary
Price to Book

1.44

Revenue and Profits:
Net Sales:
801 Cr
(Quarterly Results - Dec 2025)
Net Profit:
44 Cr
stock-summaryTotal Returns
Total Returns (Price + Dividend) stock-summary
Dividend Yield (0.85%)
TimePeriod
Price Return
Dividend Return
Total Return
3 Months
12.03%
0%
12.03%
6 Months
4.55%
0%
4.55%
1 Year
1.43%
0.91%
2.34%
2 Years
5.05%
1.56%
6.61%
3 Years
65.48%
3.10%
68.58%
4 Years
32.25%
3.92%
36.17%
5 Years
327.24%
16.93%
344.17%

Latest dividend: 3 per share ex-dividend date: Aug-29-2025

Risk Adjusted Returns v/s stock-summary
Returns Beta
Icon
Beta has not been calculated since enough price history is not available
stock-summaryNews & Corporate Actions

News

Why is Nitin Spinners Ltd falling/rising?

Recent Price Movement and Sector Context

The stock’s fall on 23-Mar is partly attributable to the broader textile sector’s downturn, which declined by 2.44% on the same day. Nitin Spinners underperformed even within this weakening sector, falling by 3.65% compared to the sector’s average drop. Intraday, the stock touched a low of ₹351, marking a 4.42% dip from previous levels. This underperformance relative to its sector peers suggests that market sentiment towards textile stocks remains cautious, impacting Nitin Spinners’ price negatively.

Adding to the pressure, the stock’s short-term technical indicators reveal a mixed picture. While the price remains above its 50-day, 100-day, and 200-day moving averages—signalling underlying strength—the shares are trading below t...

Read full news article
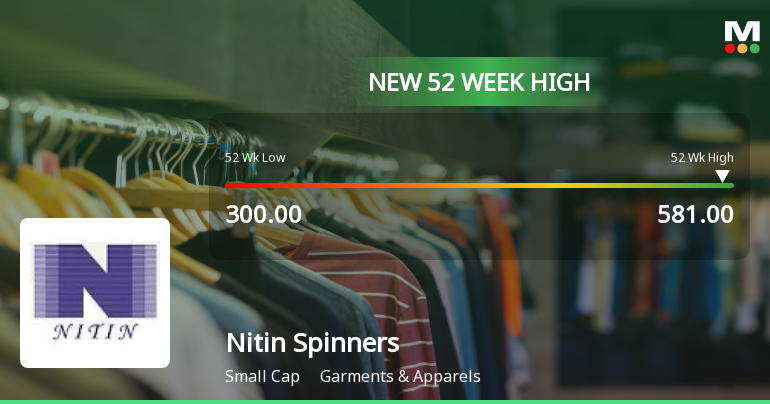
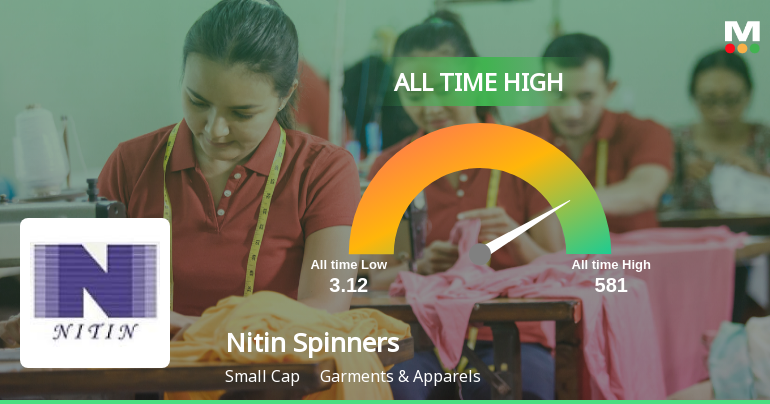
Announcements stock-summary

Nitin Spinners Limited - Other General Purpose

18-Nov-2019 | Source : NSE

Nitin Spinners Limited has submitted to the Exchange a copy ofá disclosure of Related Party Transactions and balances for the half year ended September 30, 2019.

Nitin Spinners Limited - Updates

15-Nov-2019 | Source : NSE

Nitin Spinners Limited has informed the Exchange regarding 'Submission of copy of Newspaper Advertisement in respect of Publication of Un-audited Financial Results for the Quarter and Half Year ended 30th September,2019'.

Nitin Spinners Limited - Outcome of Board Meeting

13-Nov-2019 | Source : NSE

Nitin Spinners Limited has informed the Exchange regarding Board meeting held on November 13, 2019.

Corporate Actions stock-summary

stock-summary
BOARD MEETING

No Upcoming Board Meetings

stock-summary
DIVIDEND

Nitin Spinners Ltd has declared 30% dividend, ex-date: 29 Aug 25

stock-summary
SPLITS

No Splits history available

stock-summary
BONUS

No Bonus history available

stock-summary
RIGHTS

No Rights history available

stock-summaryKey Factors

Quality key factors stock-summary

Factor
Value
Sales Growth (5y)
16.44%
EBIT Growth (5y)
20.89%
EBIT to Interest (avg)
5.37
Debt to EBITDA (avg)
2.56
Net Debt to Equity (avg)
0.66
Sales to Capital Employed (avg)
1.36
Tax Ratio
25.49%
Dividend Payout Ratio
10.69%
Pledged Shares
0
Institutional Holding
15.26%
ROCE (avg)
17.15%
ROE (avg)
19.31%

Valuation key factors

Factor
Value
P/E Ratio
12
Industry P/E
20
Price to Book Value
1.44
EV to EBIT
9.78
EV to EBITDA
6.51
EV to Capital Employed
1.27
EV to Sales
0.90
PEG Ratio
NA
Dividend Yield
0.85%
ROCE (Latest)
13.17%
ROE (Latest)
12.16%

Technicals key factors

Indicator
Weekly
Monthly
MACD
Bullish
Mildly Bearish
RSI
No Signal
No Signal
Bollinger Bands
Mildly Bullish
Bearish
Moving Averages
Bullish (Daily)
KST
Bullish
Bearish
Dow Theory
No Trend
No Trend
OBV
No Trend
No Trend
stock-summary Technical Indicator Scale: Bearish, Mildly Bearish, Sideways, Mildly Bullish, Bullish  Turned 
stock-summaryShareholding
Shareholding Snapshot : Dec 2025stock-summary
Shareholding Compare (%holding) stock-summary
Majority shareholders

Promoters

Pledged Promoter Holdings

None

Mutual Funds

Held by 4 Schemes (14.32%)

FIIs

Held by 35 FIIs (0.92%)

Promoter with highest holding

Redial Trading And Investment Private Limited (32.18%)

Highest Public shareholder

Bandhan Small Cap Fund (6.3%)

Individual Investors Holdings

22.46%

stock-summaryFinancial
[
  {
    "link": "quarterly",
    "btn_text": "All Quarterly Results",
    "header": "Quarterly Results Snapshot (Standalone) - Dec'25 - QoQ",
    "rhs": [
      {
        "prefix": "Net Sales ",
        "suffix": "QoQ Growth in quarter ended Dec 2025 is 5.34% vs -4.19% in Sep 2025",
        "dir": 1
      },
      {
        "prefix": "Standalone Net Profit ",
        "suffix": "QoQ Growth in quarter ended Dec 2025 is 27.65% vs -15.13% in Sep 2025",
        "dir": 1
      }
    ],
    "table": {
      "header": [
        "Dec'25",
        "Sep'25",
        "Change(%)"
      ],
      "body": [
        {
          "field": "Net Sales",
          "val1": "800.68",
          "val2": "760.08",
          "chgp": "5.34%",
          "chgp_class": "positive"
        },
        {
          "field": "Operating Profit (PBDIT) excl Other Income",
          "val1": "111.54",
          "val2": "99.56",
          "chgp": "12.03%",
          "chgp_class": "positive"
        },
        {
          "field": "Interest",
          "val1": "16.96",
          "val2": "16.08",
          "chgp": "5.47%",
          "chgp_class": "negative"
        },
        {
          "field": "Exceptional Items",
          "val1": "0.00",
          "val2": "0.00",
          "chgp": "",
          "chgp_class": "neutral"
        },
        {
          "field": "Standalone Net Profit",
          "val1": "44.41",
          "val2": "34.79",
          "chgp": "27.65%",
          "chgp_class": "positive"
        },
        {
          "field": "Operating Profit Margin (Excl OI)",
          "val1": "13.93%",
          "val2": "13.10%",
          "chgp": "0.83%",
          "chgp_class": "positive"
        }
      ]
    }
  },
  {
    "link": "half-yearly",
    "btn_text": "All Half Yearly Results",
    "header": "Half Yearly Results Snapshot (Standalone) - Sep'25",
    "rhs": [
      {
        "prefix": "Net Sales ",
        "suffix": " Growth in half year ended Sep 2025 is -4.43% vs 20.01% in Sep 2024",
        "dir": -1
      },
      {
        "prefix": "Standalone Net Profit ",
        "suffix": " Growth in half year ended Sep 2025 is -10.10% vs 39.08% in Sep 2024",
        "dir": -1
      }
    ],
    "table": {
      "header": [
        "Sep'25",
        "Sep'24",
        "Change(%)"
      ],
      "body": [
        {
          "field": "Net Sales",
          "val1": "1,553.40",
          "val2": "1,625.49",
          "chgp": "-4.43%",
          "chgp_class": "negative"
        },
        {
          "field": "Operating Profit (PBDIT) excl Other Income",
          "val1": "210.81",
          "val2": "233.95",
          "chgp": "-9.89%",
          "chgp_class": "negative"
        },
        {
          "field": "Interest",
          "val1": "37.11",
          "val2": "48.34",
          "chgp": "-23.23%",
          "chgp_class": "positive"
        },
        {
          "field": "Exceptional Items",
          "val1": "0.00",
          "val2": "0.00",
          "chgp": "",
          "chgp_class": "neutral"
        },
        {
          "field": "Standalone Net Profit",
          "val1": "75.77",
          "val2": "84.28",
          "chgp": "-10.10%",
          "chgp_class": "negative"
        },
        {
          "field": "Operating Profit Margin (Excl OI)",
          "val1": "13.57%",
          "val2": "14.39%",
          "chgp": "-0.82%",
          "chgp_class": "negative"
        }
      ]
    }
  },
  {
    "link": "nine-monthly",
    "btn_text": "All Nine Monthly Results",
    "header": "Nine Monthly Results Snapshot (Standalone) - Dec'25",
    "rhs": [
      {
        "prefix": "Net Sales ",
        "suffix": "YoY Growth in nine months ended Dec 2025 is -4.47% vs 17.08% in Dec 2024",
        "dir": -1
      },
      {
        "prefix": "Standalone Net Profit ",
        "suffix": "YoY Growth in nine months ended Dec 2025 is -6.88% vs 39.75% in Dec 2024",
        "dir": -1
      }
    ],
    "table": {
      "header": [
        "Dec'25",
        "Dec'24",
        "Change(%)"
      ],
      "body": [
        {
          "field": "Net Sales",
          "val1": "2,354.08",
          "val2": "2,464.36",
          "chgp": "-4.47%",
          "chgp_class": "negative"
        },
        {
          "field": "Operating Profit (PBDIT) excl Other Income",
          "val1": "322.35",
          "val2": "351.10",
          "chgp": "-8.19%",
          "chgp_class": "negative"
        },
        {
          "field": "Interest",
          "val1": "54.07",
          "val2": "69.00",
          "chgp": "-21.64%",
          "chgp_class": "positive"
        },
        {
          "field": "Exceptional Items",
          "val1": "0.00",
          "val2": "0.00",
          "chgp": "",
          "chgp_class": "neutral"
        },
        {
          "field": "Standalone Net Profit",
          "val1": "120.18",
          "val2": "129.06",
          "chgp": "-6.88%",
          "chgp_class": "negative"
        },
        {
          "field": "Operating Profit Margin (Excl OI)",
          "val1": "13.69%",
          "val2": "14.25%",
          "chgp": "-0.56%",
          "chgp_class": "negative"
        }
      ]
    }
  },
  {
    "link": "annual",
    "btn_text": "All Annual Results",
    "header": "Annual Results Snapshot (Standalone) - Mar'25",
    "rhs": [
      {
        "prefix": "Net Sales ",
        "suffix": "YoY Growth in year ended Mar 2025 is 13.77% vs 20.73% in Mar 2024",
        "dir": -1
      },
      {
        "prefix": "Standalone Net Profit ",
        "suffix": "YoY Growth in year ended Mar 2025 is 33.39% vs -20.20% in Mar 2024",
        "dir": 1
      }
    ],
    "table": {
      "header": [
        "Mar'25",
        "Mar'24",
        "Change(%)"
      ],
      "body": [
        {
          "field": "Net Sales",
          "val1": "3,305.65",
          "val2": "2,905.65",
          "chgp": "13.77%",
          "chgp_class": "positive"
        },
        {
          "field": "Operating Profit (PBDIT) excl Other Income",
          "val1": "471.42",
          "val2": "377.06",
          "chgp": "25.03%",
          "chgp_class": "positive"
        },
        {
          "field": "Interest",
          "val1": "90.38",
          "val2": "83.30",
          "chgp": "8.50%",
          "chgp_class": "negative"
        },
        {
          "field": "Exceptional Items",
          "val1": "0.00",
          "val2": "0.00",
          "chgp": "",
          "chgp_class": "neutral"
        },
        {
          "field": "Standalone Net Profit",
          "val1": "175.43",
          "val2": "131.52",
          "chgp": "33.39%",
          "chgp_class": "positive"
        },
        {
          "field": "Operating Profit Margin (Excl OI)",
          "val1": "14.26%",
          "val2": "12.98%",
          "chgp": "1.28%",
          "chgp_class": "positive"
        }
      ]
    }
  }
]

Quarterly Results Snapshot (Standalone) - Dec'25 - QoQstock-summary

Dec'25
Sep'25
Change(%)
Net Sales
800.68
760.08
5.34%
Operating Profit (PBDIT) excl Other Income
111.54
99.56
12.03%
Interest
16.96
16.08
5.47%
Exceptional Items
0.00
0.00
Standalone Net Profit
44.41
34.79
27.65%
Operating Profit Margin (Excl OI)
13.93%
13.10%
0.83%
Values in Rs Cr.
Direction Arrows
Net Sales

QoQ Growth in quarter ended Dec 2025 is 5.34% vs -4.19% in Sep 2025

Direction Arrows
Standalone Net Profit

QoQ Growth in quarter ended Dec 2025 is 27.65% vs -15.13% in Sep 2025

Half Yearly Results Snapshot (Standalone) - Sep'25stock-summary

Sep'25
Sep'24
Change(%)
Net Sales
1,553.40
1,625.49
-4.43%
Operating Profit (PBDIT) excl Other Income
210.81
233.95
-9.89%
Interest
37.11
48.34
-23.23%
Exceptional Items
0.00
0.00
Standalone Net Profit
75.77
84.28
-10.10%
Operating Profit Margin (Excl OI)
13.57%
14.39%
-0.82%
Values in Rs Cr.
Direction Arrows
Net Sales

Growth in half year ended Sep 2025 is -4.43% vs 20.01% in Sep 2024

Direction Arrows
Standalone Net Profit

Growth in half year ended Sep 2025 is -10.10% vs 39.08% in Sep 2024

Nine Monthly Results Snapshot (Standalone) - Dec'25stock-summary

Dec'25
Dec'24
Change(%)
Net Sales
2,354.08
2,464.36
-4.47%
Operating Profit (PBDIT) excl Other Income
322.35
351.10
-8.19%
Interest
54.07
69.00
-21.64%
Exceptional Items
0.00
0.00
Standalone Net Profit
120.18
129.06
-6.88%
Operating Profit Margin (Excl OI)
13.69%
14.25%
-0.56%
Values in Rs Cr.
Direction Arrows
Net Sales

YoY Growth in nine months ended Dec 2025 is -4.47% vs 17.08% in Dec 2024

Direction Arrows
Standalone Net Profit

YoY Growth in nine months ended Dec 2025 is -6.88% vs 39.75% in Dec 2024

Annual Results Snapshot (Standalone) - Mar'25stock-summary

Mar'25
Mar'24
Change(%)
Net Sales
3,305.65
2,905.65
13.77%
Operating Profit (PBDIT) excl Other Income
471.42
377.06
25.03%
Interest
90.38
83.30
8.50%
Exceptional Items
0.00
0.00
Standalone Net Profit
175.43
131.52
33.39%
Operating Profit Margin (Excl OI)
14.26%
12.98%
1.28%
Values in Rs Cr.
Direction Arrows
Net Sales

YoY Growth in year ended Mar 2025 is 13.77% vs 20.73% in Mar 2024

Direction Arrows
Standalone Net Profit

YoY Growth in year ended Mar 2025 is 33.39% vs -20.20% in Mar 2024

stock-summaryCompany CV
About Nitin Spinners Ltd stock-summary
stock-summary
Nitin Spinners Ltd
Small Cap
Garments & Apparels
Nitin Spinners Limited was incorporated on 15th October, 1992 as a private limited Company with the name Nitin Spinners Private Limited. On November 15, 1994, the company was converted into Public Limited company and the name was changed to Nitin Spinners Limited. Nitin Spinners is an ISO 9001:2008 company and a Government of India recognized Export House, manufacturing 100% Cotton and Blended Yarn, Knitted Fabrics and Woven Fabrics.
Company Coordinates stock-summary
Company Details
16-17 KM Stone, Chittor Highway Hamirgarh Bhilwara Rajasthan : 311025
stock-summary
Tel: 91-1482-286110-113
stock-summary
nsl@nitinspinners.com
Registrar Details
Bigshare Services Pvt Ltd , E-2 , Ansa Industrial Estate, Saki Vihar Road, Saki Naka, Andheri (E), Mumbai