
Compare Dollar Industrie with Similar Stocks
Dashboard
Poor long term growth as Net Sales has grown by an annual rate of 12.65% and Operating profit at 5.47% over the last 5 years
Flat results in Mar 26
Despite the size of the company, domestic mutual funds hold only 0% of the company
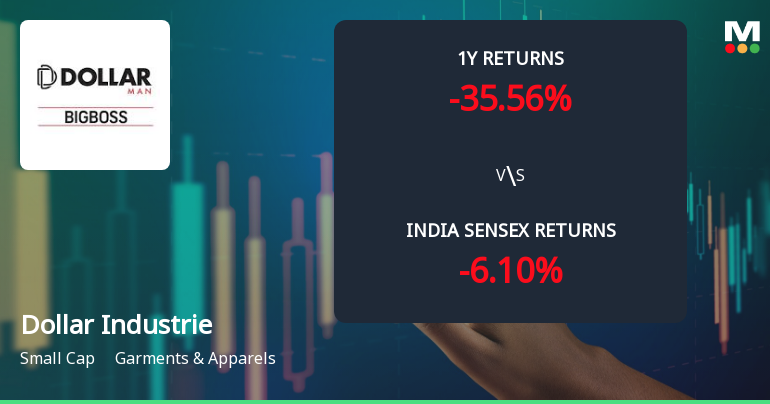
Below par performance in long term as well as near term
Stock DNA
Garments & Apparels
INR 1,454 Cr (Small Cap)
14.00
25
1.14%
0.31
11.32%
1.58
Total Returns (Price + Dividend) 
Latest dividend: 3 per share ex-dividend date: Jul-18-2025
Risk Adjusted Returns v/s
Returns Beta

News
Dollar Industries Ltd Technical Momentum Shifts Amid Prolonged Downtrend
Dollar Industries Ltd, a small-cap player in the Garments & Apparels sector, has experienced a subtle shift in its technical momentum, moving from a bearish to a mildly bearish trend. Despite this slight improvement, key technical indicators continue to signal caution for investors, reflecting ongoing challenges in price momentum and market sentiment.
Read full news article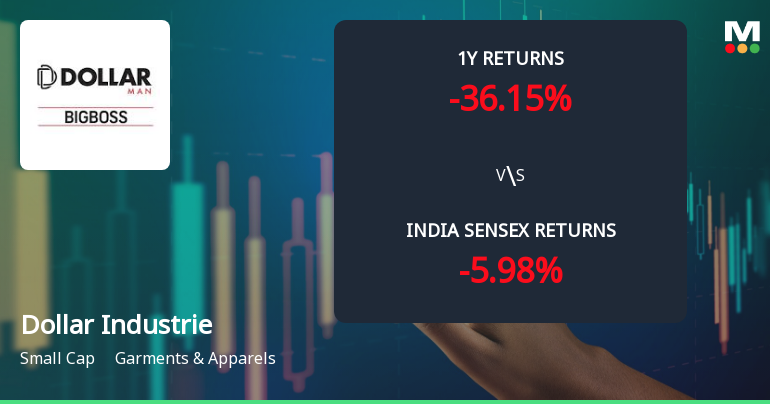
Dollar Industries Ltd Faces Bearish Technical Shift Amid Weak Price Momentum
Dollar Industries Ltd, a small-cap player in the Garments & Apparels sector, has witnessed a notable shift in its technical momentum, with key indicators signalling a bearish trend. Despite a modest intraday gain of 1.63% to close at ₹253.00 on 16 Jun 2026, the stock’s broader technical outlook has deteriorated, prompting a downgrade in its Mojo Grade from Hold to Sell as of 5 Jan 2026.
Read full news article
Dollar Industries Ltd Technical Momentum Shifts Amid Bearish Market Sentiment
Dollar Industries Ltd, a small-cap player in the Garments & Apparels sector, has experienced a notable shift in its technical momentum, reflecting a complex interplay of bearish and mildly bullish signals. Despite a recent 2.03% rise in its share price to ₹248.95, the stock continues to face headwinds amid a deteriorating fundamental outlook and a downgrade in its MarketsMOJO Mojo Grade from Hold to Sell as of 05 Jan 2026.
Read full news article Announcements
Disclosure Under Regulation 30 Of The SEBI (Listing Obligations And Disclosure Requirements) Regulations 2015 - Notice Of Meetings Of Equity Shareholders And Unsecured Creditors In Connection With The Composite Scheme Of Arrangement
18-Jun-2026 | Source : BSEPlease find enclosed herewith Notice of Meeting of Equity Shareholders and Unsecured Creditors in connection with Composite Scheme of Arrangement
Disclosure Under Regulation 30 Of The SEBI (Listing Obligations And Disclosure Requirements) Regulations 2015 - Notice Of Meetings Of Equity Shareholders And Unsecured Creditors In Connection With The Composite Scheme Of Arrangement
18-Jun-2026 | Source : BSEPlease find enclosed herewith Notice of Meeting of Equity Shareholder and Unsecured Creditor in connection with Composite scheme of Arrangement
Announcement under Regulation 30 (LODR)-Newspaper Publication
05-Jun-2026 | Source : BSEPlease find enclosed Newspaper Publication w.r.t Transfer and Dematerialization of physical securities via SEBI Circular dated 30th January 2026
Corporate Actions

No Upcoming Board Meetings

Dollar Industries Ltd has declared 150% dividend, ex-date: 28 Jul 26

Dollar Industries Ltd has announced 2:10 stock split, ex-date: 31 Aug 17

No Bonus history available

No Rights history available
Quality key factors
Valuation key factors
Technicals key factors
 Technical Indicator Scale: Bearish, Mildly Bearish, Sideways, Mildly Bullish, Bullish Turned
 Shareholding Snapshot : Mar 2026
Shareholding Compare (%holding)
Promoters
None
Held by 1 Schemes (0.0%)
Held by 28 FIIs (4.98%)
Dollar Holdings Private Limited (46.28%)
Fidelity Funds - Asian Smaller Companies (3.18%)
13.09%
Quarterly Results Snapshot (Consolidated) - Mar'26 - YoY

YoY Growth in quarter ended Mar 2026 is 13.19% vs 9.83% in Mar 2025
YoY Growth in quarter ended Mar 2026 is 11.38% vs -11.60% in Mar 2025
Half Yearly Results Snapshot (Consolidated) - Sep'25
Growth in half year ended Sep 2025 is 11.58% vs 5.38% in Sep 2024
Growth in half year ended Sep 2025 is 35.08% vs 6.14% in Sep 2024
Nine Monthly Results Snapshot (Consolidated) - Dec'25
YoY Growth in nine months ended Dec 2025 is 8.44% vs 8.30% in Dec 2024
YoY Growth in nine months ended Dec 2025 is 21.14% vs 8.19% in Dec 2024
Annual Results Snapshot (Consolidated) - Mar'26
YoY Growth in year ended Mar 2026 is 9.97% vs 8.79% in Mar 2025
YoY Growth in year ended Mar 2026 is 18.00% vs 0.93% in Mar 2025
About Dollar Industries Ltd

Company Coordinates


