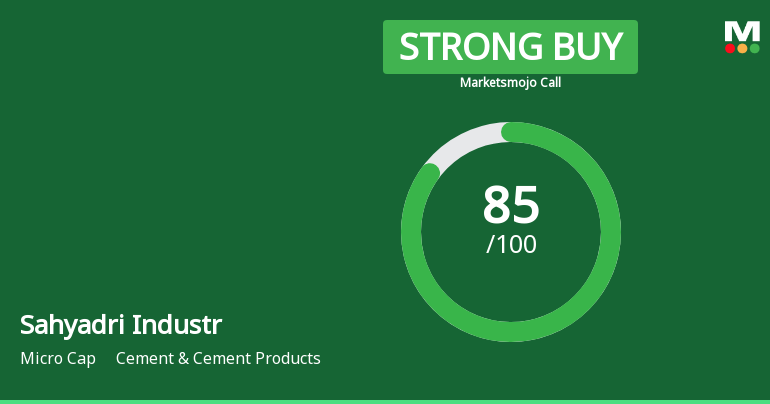
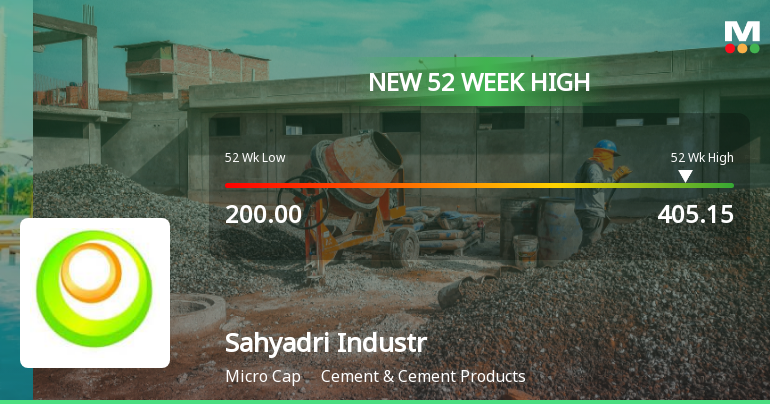
Sahyadri Industr

  • Market Cap: Micro Cap
  • Industry: Cement & Cement Products
  • ISIN: INE280H01015
  • NSEID: SAHYADRI
  • BSEID: 532841
INR
363.25
-2.85 (-0.78%)
BSENSE

Aug 14, 04:01 PM

BSE+NSE Vol: 17.16 k

  • Price Points
  • Score
  • Mojo Parameters
  • Total Return
  • News and Corporate Actions
  • Key factors
  • Shareholding
  • Financials
  • CompanyCV
stock-summaryPrice Point
High/Low

1Day

52 Week

Valuation
Technical
Day's Volume

CASH

17.16 k (-82.45%) Volume

Shareholding (Jun 2026)

FII

0.01%

Held by 1 FIIs

DII

0.01%

Held by 0 DIIs

Promoter

71.12%

Why is Sahyadri Industries Ltd falling/rising?

14-Aug-2026

As of 13-Aug, Sahyadri Industries Ltd's stock price has risen to 366.10, reflecting a 6.21% increase. This growth is driven by strong performance metrics, increased trading volume, and positive investor sentiment, including a new 52-week high of Rs. 378.3.

As of 13-Aug, Sahyadri Industries Ltd is experiencing a rise in its stock price, currently at 366.10, which reflects an increase of 21.4 or 6.21%. This upward movement can be attributed to several factors. <BR><BR>Firstly, the stock has shown strong performance over various periods, with a notable increase of 33.61% over the past month, significantly outperforming the Sensex, which only gained 0.60% in the same timeframe. Year-to-date, the stock has risen by 44.56%, while the Sensex has declined by 8.38%. This trend indicates a robust demand for Sahyadri Industries Ltd shares compared to the broader market.<BR><BR>Additionally, the stock reached a new 52-week high of Rs. 378.3 today, which is a positive indicator of investor confidence. The stock has also been on a consecutive gain streak for the last two days, accumulating a total return of 7.12% during this period. It opened with a gap up of 2.99% today, further signaling bullish sentiment among investors.<BR><BR>Moreover, the trading volume has seen a significant increase, with delivery volume on 12 August rising by 518.76% compared to the 5-day average, suggesting heightened investor participation. The stock is also trading above its moving averages across multiple time frames, which typically indicates a strong upward trend.<BR><BR>Overall, the combination of strong recent performance, increased trading volume, and positive technical indicators contributes to the rising stock price of Sahyadri Industries Ltd.

View full answer

Should I buy, sell or hold Sahyadri Industries Ltd?

14-Aug-2026

Who are in the management team of Sahyadri Industr?

14-Aug-2026

The management team of Sahyadri Industries includes J P Patel (Chairman & Wholetime Director), S V Patel (Managing Director), and several independent directors, along with other key executives like Tuljaram Maheshwari (COO & CFO) and Rajib K. Gope (Company Secretary). They oversee the company's strategic direction and management.

The management team of Sahyadri Industries includes the following members:<BR><BR>1. **J P Patel** - Chairman & Wholetime Director<BR>2. **S V Patel** - Managing Director<BR>3. **S B Malegaonkar** - Independent Director<BR>4. **Moushmi Sahil Shaha** - Independent Director<BR>5. **Ankem Sri Prasad Mohan** - Independent Director<BR>6. **Tuljaram Maheshwari** - Whole-time Director, COO & CFO<BR>7. **S U Joshi** - Whole-time Director<BR>8. **Ved Prakash Saxena** - Independent Director<BR>9. **Rajib K. Gope** - Company Secretary & Compliance Officer<BR><BR>This team is responsible for the strategic direction and management of the company.

View full answer

What does Sahyadri Industr do?

14-Aug-2026

Sahyadri Industries Ltd produces cement sheets and accessories, trades steel doors, and generates wind power electricity. As of June 2026, it reported net sales of ₹258 Cr and a net profit of ₹27 Cr, with a market cap of ₹407 Cr.

Overview: <BR>Sahyadri Industries Ltd is engaged in the production of cement sheets and accessories, trading of steel doors, and generation of wind power electricity, operating within the Cement & Cement Products industry as a Micro Cap company.<BR><BR>History: <BR>Sahyadri Industries Ltd was incorporated in 1994. The latest quarterly results reported net sales and net profit for June 2026.<BR><BR>Financial Snapshot: <BR>Net Sales: 258 Cr (Quarterly Results - Jun 2026) <BR>Net Profit: 27 Cr (Quarterly Results - Jun 2026) <BR>Market Cap: INR 407 Cr (Micro Cap)<BR><BR>Key Metrics: <BR>P/E: 9.00 <BR>Industry P/E: 13 <BR>Dividend Yield: 0.72% <BR>Debt-Equity: -0.07 <BR>Return on Equity: 7.26% <BR>Price to Book: 0.93<BR><BR>Contact Details: <BR>Address: Swastik House 39/D Gultekadi, Jawaharlal Nehru Road Pune Maharashtra : 411037 <BR>Tel: 91-20-26444625/26/27 <BR>Email: swastikroofing@silworld.in/info@sil <BR>Website: http://www.silworld.in

View full answer

Who are the peers of the Sahyadri Industr?

14-Aug-2026

Sahyadri Industr's peers include Deccan Cements, Saurashtra Cement, BIGBLOC Construction, and others. It has average management risk and below average growth, with a 1-year return of 24.54%, outperforming Deccan Cements but underperforming Kesoram Industries.

Peers: The peers of Sahyadri Industr are Deccan Cements, Saurashtra Cem., BIGBLOC Const., Shiva Cement, Andhra Cements, Kesoram Inds., Anjani Portland, Shri Keshav, Kanoria Energy, and Barak Valley.<BR><BR>Quality Snapshot: Excellent management risk is observed at Saurashtra Cem. and Kanoria Energy, while Average management risk is found at Deccan Cements, BIGBLOC Const., and Sahyadri Industr. Below Average management risk is present at Andhra Cements, Kesoram Inds., Anjani Portland, Shri Keshav, and the rest. Growth ratings show that Sahyadri Industr has Below Average growth, alongside Deccan Cements, BIGBLOC Const., Saurashtra Cem., Andhra Cements, Kesoram Inds., Anjani Portland, and the rest. Capital Structure is rated as Good for Sahyadri Industr, while Below Average is noted for Deccan Cements, BIGBLOC Const., Andhra Cements, Kesoram Inds., Anjani Portland, Shri Keshav, and the rest.<BR><BR>Return Snapshot: Kesoram Inds. has the highest 1-year return at 123.12%, while Deccan Cements has the lowest at -49.02%. Sahyadri Industr's 1-year return is 24.54%, which is significantly higher than Deccan Cements but lower than Kesoram Inds. Additionally, peers such as Deccan Cements, Saurashtra Cem., Shiva Cement, Andhra Cements, Anjani Portland, Shri Keshav, Kanoria Energy, and Barak Valley have negative six-month returns.

View full answer

How big is Sahyadri Industr?

14-Aug-2026

As of 14th August, Sahyadri Industries Ltd has a market capitalization of 401.00 Cr and reported net sales of 721.06 Cr and net profit of 44.75 Cr over the latest four quarters.

As of 14th August, <BR><BR>Market Cap: Sahyadri Industries Ltd has a market capitalization of 401.00 Cr and is classified as a Micro Cap.<BR><BR>Recent Quarterly Performance: The sum of Net Sales for the latest 4 quarters is 721.06 Cr, while the sum of Net Profit for the same period is 44.75 Cr.<BR><BR>Balance Sheet Snapshot: The reporting period for the latest annual data is March 2026. Shareholder's Funds are valued at 406.09 Cr, and Total Assets amount to 532.10 Cr.

View full answer

Has Sahyadri Industries Ltd declared dividend?

14-Aug-2026

Yes, Sahyadri Industries Ltd has declared a 25% dividend, amounting to approximately 1.48 per share, with an ex-date of August 21, 2026. The dividend yield is 0.68%, and while recent short-term returns have been positive, longer-term returns have been negative.

Sahyadri Industries Ltd has declared a 25% dividend.<BR><BR>Dividend Details:<BR>- Percentage announced: 25%<BR>- Amount per share: 1.484779411764706<BR>- Ex-date: 21 Aug 26<BR><BR>Dividend Yield: 0.68%<BR><BR>Total Returns by Period:<BR>In the last 3 months, the price return was 14.23%, the dividend return was 1.29%, resulting in a total return of 15.52%.<BR><BR>Over the past 6 months, the price return reached 40.44%, with a dividend return of 1.54%, leading to a total return of 41.98%.<BR><BR>In the 1-year period, the price return was 21.96%, the dividend return was 1.40%, culminating in a total return of 23.36%.<BR><BR>For the 2-year period, the price return was 6.21%, the dividend return was 1.35%, resulting in a total return of 7.56%.<BR><BR>In the last 3 years, the price return was -12.93%, with a dividend return of 1.38%, leading to a total return of -11.55%.<BR><BR>Over the past 4 years, the price return was -14.56%, the dividend return was 2.26%, resulting in a total return of -12.3%.<BR><BR>In the 5-year period, the price return was -50.09%, with a dividend return of 2.22%, leading to a total return of -47.87%.<BR><BR>Overall, Sahyadri Industries Ltd has declared a dividend and has shown varying total returns across different periods, with significant positive returns in the short term but negative returns over the longer term. The dividend yield indicates a modest return from dividends relative to the share price.

View full answer

When is the next results date for Sahyadri Industries Ltd?

06-Aug-2026

The next results date for Sahyadri Industries Ltd is 12 August 2026.

The next results date for Sahyadri Industries Ltd is scheduled for 12 August 2026.

View full answer

Are Sahyadri Industries Ltd latest results good or bad?

10-May-2026

Sahyadri Industries Ltd's latest results are positive, with a 34.64% increase in net sales and a 147.10% rise in net profit for the quarter ending March 2026. However, potential investors should be cautious due to past earnings volatility and the cyclical nature of the business.

Sahyadri Industries Ltd's latest results can be characterized as good, particularly in terms of revenue and profit growth. For the quarter ending March 2026, the company reported net sales of ₹194.09 crores, which represents a significant increase of 34.64% sequentially and 28.60% year-on-year. This marks the strongest quarterly sales figure in recent history, indicating robust demand in the cement products segment.<BR><BR>Additionally, the net profit for the same quarter surged to ₹10.55 crores, reflecting a remarkable growth of 147.10% quarter-on-quarter and 147.07% year-on-year. The operating margins also improved to 9.67%, up from 9.12% in the previous quarter, showcasing better cost management as sales increased.<BR><BR>However, it's important to note that while the recent performance is strong, the company has exhibited significant quarterly volatility in its earnings over the past year. This raises concerns about the sustainability of such profitability and operational consistency moving forward. Overall, the latest results are positive, but potential investors should remain cautious about the cyclical nature of the business and the historical fluctuations in performance.

View full answer

How has been the historical performance of Sahyadri Industr?

31-Oct-2025

Sahyadri Industr experienced a decline in key financial metrics from March 2024 to March 2025, with net sales dropping from 631.81 Cr to 600.53 Cr and profit after tax decreasing from 26.37 Cr to 19.46 Cr, indicating a challenging year for the company. Total liabilities and assets also fell, while cash flow from operating activities remained stable.

Answer:<BR>The historical performance of Sahyadri Industr shows a fluctuating trend in key financial metrics over the years.<BR><BR>Breakdown:<BR>Sahyadri Industr's net sales peaked at 631.81 Cr in March 2024 but decreased to 600.53 Cr in March 2025. The total operating income followed a similar trend, declining from 634.27 Cr in March 2024 to 605.22 Cr in March 2025. The company's operating profit (PBDIT) also saw a decrease from 70.60 Cr in March 2024 to 58.03 Cr in March 2025, reflecting a drop in the operating profit margin from 10.52% to 9.07%. Profit before tax decreased from 35.30 Cr in March 2024 to 26.18 Cr in March 2025, leading to a profit after tax of 19.46 Cr in March 2025, down from 26.37 Cr the previous year. The company's total liabilities decreased from 559.82 Cr in March 2024 to 542.91 Cr in March 2025, while total assets also fell from 559.82 Cr to 542.91 Cr in the same period. Cash flow from operating activities remained relatively stable at 53.00 Cr in March 2025 compared to 57.00 Cr in March 2024, but the net cash outflow was recorded at -2.00 Cr in March 2025, indicating a decline in cash position. Overall, the data reflects a challenging year for Sahyadri Industr, with declines in sales, profits, and cash flow.

View full answer

Is Sahyadri Industr overvalued or undervalued?

09-Jun-2025

As of September 18, 2024, Sahyadri Industr is considered very attractive and undervalued, with favorable valuation metrics including a PE Ratio of 16.55, an EV to EBITDA of 6.99, and a Price to Book Value of 0.86, indicating it trades at a discount compared to competitors like Shankara Build and Indian Hume Pipe, despite a year-to-date return of -7.37%.

As of 18 September 2024, the valuation grade for Sahyadri Industr has moved from attractive to very attractive, indicating a significant positive shift in its perceived value. The company is currently assessed as undervalued. Key ratios supporting this assessment include a PE Ratio of 16.55, an EV to EBITDA of 6.99, and a Price to Book Value of 0.86, all of which suggest favorable valuation metrics compared to its peers.<BR><BR>In comparison to notable competitors, Sahyadri Industr's PE Ratio is significantly lower than Shankara Build. at 29.29 and Indian Hume Pipe at 24.44, indicating that Sahyadri is trading at a discount relative to these firms. Additionally, its EV to EBITDA is more attractive than that of Ramco Inds., which stands at 13.62. Despite recent underperformance in the stock's year-to-date return of -7.37% compared to the Sensex's 5.61%, the overall valuation metrics suggest that Sahyadri Industr presents a compelling investment opportunity at its current price of 297.45.

View full answer

What is the technical trend for Sahyadri Industr?

09-Jun-2025

As of April 15, 2025, Sahyadri Industr's technical trend is mildly bearish, with mixed signals from key indicators like the weekly MACD being mildly bullish and the monthly MACD remaining bearish.

As of 15 April 2025, the technical trend for Sahyadri Industr has changed from bearish to mildly bearish. The weekly MACD indicates a mildly bullish stance, while the monthly MACD remains bearish. The daily moving averages are showing a mildly bearish trend. The Bollinger Bands suggest a bullish outlook on the weekly chart but a mildly bearish one on the monthly. The KST is mildly bullish weekly but bearish monthly, and the OBV shows mild bullishness in both time frames. Overall, the current technical stance is mildly bearish with key indicators such as the daily moving averages and monthly MACD contributing to this view.

View full answer

Who are the top shareholders of the Sahyadri Industr?

06-Jun-2025

The top shareholders of Sahyadri Industries include promoter Vallabh Lalji Patel with 8.08%, public shareholder Suryatej Advisors LLP with 1.66%, and individual investors holding 22.68%. There are no pledged promoter holdings or mutual funds invested in the company.

The top shareholders of Sahyadri Industries include the promoters, who hold the majority of the shares. The promoter with the highest holding is Vallabh Lalji Patel, owning 8.08% of the company. In terms of public shareholders, Suryatej Advisors LLP holds 1.66%. Additionally, individual investors collectively hold 22.68% of the shares. There is also one Foreign Institutional Investor (FII) that holds 0.04% of the company. Notably, there are no pledged promoter holdings and no mutual funds currently invested in Sahyadri Industries.

View full answer
iScoreScore
Click here to find our call on this stock
Strong Sell
Sell
Hold
Buy
Strong Buy

Dashboard

1

Strong ability to service debt as the company has a low Debt to EBITDA ratio of 0.70 times

 
2

With a growth in Net Profit of 146.24%, the company declared Outstanding results in Jun 26

3

With ROE of 11.1, it has a Very Attractive valuation with a 1 Price to Book Value

4

Majority shareholders : Promoters

 
5

Market Beating Performance

stock-summaryMojo Parameters

Mojo Parameters

Loading Valuation Snapshot...

Stock DNA

stock-summary
Industry

Cement & Cement Products

stock-summary
Market cap

INR 401 Cr (Micro Cap)

stock-summary
P/E

9.00

stock-summary
Industry P/E

12

stock-summary
Dividend Yield

0.68%

stock-summary
Debt Equity

-0.07

stock-summary
Return on Equity

11.14%

stock-summary
Price to Book

0.99

Revenue and Profits:
Net Sales:
258 Cr
(Quarterly Results - Jun 2026)
Net Profit:
27 Cr
stock-summaryTotal Returns
Total Returns (Price + Dividend) stock-summary
Dividend Yield (0.68%)
TimePeriod
Price Return
Dividend Return
Total Return
3 Months
14.23%
1.29%
15.52%
6 Months
40.44%
1.54%
41.98%
1 Year
21.96%
1.39%
23.35%
2 Years
6.21%
1.35%
7.56%
3 Years
-12.93%
1.40%
-11.53%
4 Years
-14.56%
2.26%
-12.3%
5 Years
-50.09%
2.29%
-47.8%

Latest dividend: 1.484779411764706 per share ex-dividend date: Aug-07-2026

Risk Adjusted Returns v/s stock-summary
Returns Beta
Icon
Beta has not been calculated since enough price history is not available
stock-summaryNews & Corporate Actions

News

Announcements stock-summary

Announcement under Regulation 30 (LODR)-Newspaper Publication

13-Aug-2026 | Source : BSE

Newspaper Publication copies of Unaudited Financial Results for the quarter ended 30th June 2026.

Board Meeting Outcome for Unaudited Financial Results And Interim Dividend

12-Aug-2026 | Source : BSE

As per attachment

Corporate Action-Board approves Dividend

12-Aug-2026 | Source : BSE

Interim Dividend declared Rs.2.50 per share

Corporate Actions stock-summary

stock-summary
BOARD MEETING

No Upcoming Board Meetings

stock-summary
DIVIDEND

Sahyadri Industries Ltd has declared 25% dividend, ex-date: 21 Aug 26

stock-summary
SPLITS

No Splits history available

stock-summary
BONUS

No Bonus history available

stock-summary
RIGHTS

No Rights history available

stock-summaryKey Factors

Quality key factors stock-summary

Factor
Value
Sales Growth (5y)
6.81%
EBIT Growth (5y)
-8.83%
EBIT to Interest (avg)
9.46
Debt to EBITDA (avg)
1.08
Net Debt to Equity (avg)
-0.07
Sales to Capital Employed (avg)
1.42
Tax Ratio
25.09%
Dividend Payout Ratio
5.66%
Pledged Shares
0
Institutional Holding
0.01%
ROCE (avg)
16.78%
ROE (avg)
10.14%

Valuation key factors

Factor
Value
P/E Ratio
9
Industry P/E
12
Price to Book Value
0.98
EV to EBIT
6.58
EV to EBITDA
4.60
EV to Capital Employed
0.98
EV to Sales
0.51
PEG Ratio
0.06
Dividend Yield
0.69%
ROCE (Latest)
6.76%
ROE (Latest)
11.14%

Technicals key factors

Indicator
Weekly
Monthly
MACD
Bullish
Mildly Bullish
RSI
No Signal
No Signal
Bollinger Bands
Bullish
Bullish
Moving Averages
Bullish (Daily)
KST
Bullish
Mildly Bullish
Dow Theory
Mildly Bullish
Mildly Bullish
OBV
Bullish
Bullish
stock-summary Technical Indicator Scale: Bearish, Mildly Bearish, Sideways, Mildly Bullish, Bullish  Turned 
stock-summaryShareholding
Shareholding Snapshot : Jun 2026stock-summary
Shareholding Compare (%holding) stock-summary
Majority shareholders

Promoters

Pledged Promoter Holdings

None

Mutual Funds

Held by 0 Schemes

FIIs

Held by 1 FIIs (0.01%)

Promoter with highest holding

Vallabh Lalji Patel (8.08%)

Highest Public shareholder

Suryatej Advisors Llp (1.66%)

Individual Investors Holdings

22.95%

stock-summaryFinancial
[
  {
    "link": "quarterly",
    "btn_text": "All Quarterly Results",
    "header": "Quarterly Results Snapshot (Standalone) - Jun'26 - YoY",
    "rhs": [
      {
        "prefix": "Net Sales ",
        "suffix": "YoY Growth in quarter ended Jun 2026 is 20.65% vs -1.14% in Jun 2025",
        "dir": 1
      },
      {
        "prefix": "Standalone Net Profit ",
        "suffix": "YoY Growth in quarter ended Jun 2026 is 146.24% vs -13.77% in Jun 2025",
        "dir": 1
      }
    ],
    "table": {
      "header": [
        "Jun'26",
        "Jun'25",
        "Change(%)"
      ],
      "body": [
        {
          "field": "Net Sales",
          "val1": "258.42",
          "val2": "214.19",
          "chgp": "20.65%",
          "chgp_class": "positive"
        },
        {
          "field": "Operating Profit (PBDIT) excl Other Income",
          "val1": "39.04",
          "val2": "20.23",
          "chgp": "92.98%",
          "chgp_class": "positive"
        },
        {
          "field": "Interest",
          "val1": "0.54",
          "val2": "1.07",
          "chgp": "-49.53%",
          "chgp_class": "positive"
        },
        {
          "field": "Exceptional Items",
          "val1": "0.00",
          "val2": "0.00",
          "chgp": "",
          "chgp_class": "neutral"
        },
        {
          "field": "Standalone Net Profit",
          "val1": "26.52",
          "val2": "10.77",
          "chgp": "146.24%",
          "chgp_class": "positive"
        },
        {
          "field": "Operating Profit Margin (Excl OI)",
          "val1": "15.11%",
          "val2": "9.44%",
          "chgp": "5.67%",
          "chgp_class": "positive"
        }
      ]
    }
  },
  {
    "link": "half-yearly",
    "btn_text": "All Half Yearly Results",
    "header": "Half Yearly Results Snapshot (Standalone) - Sep'25",
    "rhs": [
      {
        "prefix": "Net Sales ",
        "suffix": " Growth in half year ended Sep 2025 is 5.84% vs -7.17% in Sep 2024",
        "dir": 1
      },
      {
        "prefix": "Standalone Net Profit ",
        "suffix": " Growth in half year ended Sep 2025 is -6.52% vs -23.70% in Sep 2024",
        "dir": 1
      }
    ],
    "table": {
      "header": [
        "Sep'25",
        "Sep'24",
        "Change(%)"
      ],
      "body": [
        {
          "field": "Net Sales",
          "val1": "338.58",
          "val2": "319.89",
          "chgp": "5.84%",
          "chgp_class": "positive"
        },
        {
          "field": "Operating Profit (PBDIT) excl Other Income",
          "val1": "29.17",
          "val2": "33.72",
          "chgp": "-13.49%",
          "chgp_class": "negative"
        },
        {
          "field": "Interest",
          "val1": "1.90",
          "val2": "3.34",
          "chgp": "-43.11%",
          "chgp_class": "positive"
        },
        {
          "field": "Exceptional Items",
          "val1": "0.00",
          "val2": "0.00",
          "chgp": "",
          "chgp_class": "neutral"
        },
        {
          "field": "Standalone Net Profit",
          "val1": "13.48",
          "val2": "14.42",
          "chgp": "-6.52%",
          "chgp_class": "negative"
        },
        {
          "field": "Operating Profit Margin (Excl OI)",
          "val1": "8.62%",
          "val2": "10.54%",
          "chgp": "-1.92%",
          "chgp_class": "negative"
        }
      ]
    }
  },
  {
    "link": "nine-monthly",
    "btn_text": "All Nine Monthly Results",
    "header": "Nine Monthly Results Snapshot (Standalone) - Dec'25",
    "rhs": [
      {
        "prefix": "Net Sales ",
        "suffix": "YoY Growth in nine months ended Dec 2025 is 7.37% vs -6.17% in Dec 2024",
        "dir": 1
      },
      {
        "prefix": "Standalone Net Profit ",
        "suffix": "YoY Growth in nine months ended Dec 2025 is 21.54% vs -31.22% in Dec 2024",
        "dir": 1
      }
    ],
    "table": {
      "header": [
        "Dec'25",
        "Dec'24",
        "Change(%)"
      ],
      "body": [
        {
          "field": "Net Sales",
          "val1": "482.74",
          "val2": "449.60",
          "chgp": "7.37%",
          "chgp_class": "positive"
        },
        {
          "field": "Operating Profit (PBDIT) excl Other Income",
          "val1": "42.32",
          "val2": "41.73",
          "chgp": "1.41%",
          "chgp_class": "positive"
        },
        {
          "field": "Interest",
          "val1": "2.82",
          "val2": "5.20",
          "chgp": "-45.77%",
          "chgp_class": "positive"
        },
        {
          "field": "Exceptional Items",
          "val1": "-0.64",
          "val2": "0.00",
          "chgp": "",
          "chgp_class": "neutral"
        },
        {
          "field": "Standalone Net Profit",
          "val1": "18.45",
          "val2": "15.18",
          "chgp": "21.54%",
          "chgp_class": "positive"
        },
        {
          "field": "Operating Profit Margin (Excl OI)",
          "val1": "8.74%",
          "val2": "9.20%",
          "chgp": "-0.46%",
          "chgp_class": "negative"
        }
      ]
    }
  },
  {
    "link": "annual",
    "btn_text": "All Annual Results",
    "header": "Annual Results Snapshot (Standalone) - Mar'26",
    "rhs": [
      {
        "prefix": "Net Sales ",
        "suffix": "YoY Growth in year ended Mar 2026 is 12.71% vs -4.95% in Mar 2025",
        "dir": 1
      },
      {
        "prefix": "Standalone Net Profit ",
        "suffix": "YoY Growth in year ended Mar 2026 is 49.02% vs -26.20% in Mar 2025",
        "dir": 1
      }
    ],
    "table": {
      "header": [
        "Mar'26",
        "Mar'25",
        "Change(%)"
      ],
      "body": [
        {
          "field": "Net Sales",
          "val1": "676.83",
          "val2": "600.53",
          "chgp": "12.71%",
          "chgp_class": "positive"
        },
        {
          "field": "Operating Profit (PBDIT) excl Other Income",
          "val1": "61.08",
          "val2": "54.46",
          "chgp": "12.16%",
          "chgp_class": "positive"
        },
        {
          "field": "Interest",
          "val1": "3.33",
          "val2": "7.02",
          "chgp": "-52.56%",
          "chgp_class": "positive"
        },
        {
          "field": "Exceptional Items",
          "val1": "-0.64",
          "val2": "0.00",
          "chgp": "",
          "chgp_class": "neutral"
        },
        {
          "field": "Standalone Net Profit",
          "val1": "29.00",
          "val2": "19.46",
          "chgp": "49.02%",
          "chgp_class": "positive"
        },
        {
          "field": "Operating Profit Margin (Excl OI)",
          "val1": "9.02%",
          "val2": "9.07%",
          "chgp": "-0.05%",
          "chgp_class": "negative"
        }
      ]
    }
  }
]

Quarterly Results Snapshot (Standalone) - Jun'26 - YoYstock-summary

Jun'26
Jun'25
Change(%)
Net Sales
258.42
214.19
20.65%
Operating Profit (PBDIT) excl Other Income
39.04
20.23
92.98%
Interest
0.54
1.07
-49.53%
Exceptional Items
0.00
0.00
Standalone Net Profit
26.52
10.77
146.24%
Operating Profit Margin (Excl OI)
15.11%
9.44%
5.67%
Values in Rs Cr.
Direction Arrows
Net Sales

YoY Growth in quarter ended Jun 2026 is 20.65% vs -1.14% in Jun 2025

Direction Arrows
Standalone Net Profit

YoY Growth in quarter ended Jun 2026 is 146.24% vs -13.77% in Jun 2025

Half Yearly Results Snapshot (Standalone) - Sep'25stock-summary

Sep'25
Sep'24
Change(%)
Net Sales
338.58
319.89
5.84%
Operating Profit (PBDIT) excl Other Income
29.17
33.72
-13.49%
Interest
1.90
3.34
-43.11%
Exceptional Items
0.00
0.00
Standalone Net Profit
13.48
14.42
-6.52%
Operating Profit Margin (Excl OI)
8.62%
10.54%
-1.92%
Values in Rs Cr.
Direction Arrows
Net Sales

Growth in half year ended Sep 2025 is 5.84% vs -7.17% in Sep 2024

Direction Arrows
Standalone Net Profit

Growth in half year ended Sep 2025 is -6.52% vs -23.70% in Sep 2024

Nine Monthly Results Snapshot (Standalone) - Dec'25stock-summary

Dec'25
Dec'24
Change(%)
Net Sales
482.74
449.60
7.37%
Operating Profit (PBDIT) excl Other Income
42.32
41.73
1.41%
Interest
2.82
5.20
-45.77%
Exceptional Items
-0.64
0.00
Standalone Net Profit
18.45
15.18
21.54%
Operating Profit Margin (Excl OI)
8.74%
9.20%
-0.46%
Values in Rs Cr.
Direction Arrows
Net Sales

YoY Growth in nine months ended Dec 2025 is 7.37% vs -6.17% in Dec 2024

Direction Arrows
Standalone Net Profit

YoY Growth in nine months ended Dec 2025 is 21.54% vs -31.22% in Dec 2024

Annual Results Snapshot (Standalone) - Mar'26stock-summary

Mar'26
Mar'25
Change(%)
Net Sales
676.83
600.53
12.71%
Operating Profit (PBDIT) excl Other Income
61.08
54.46
12.16%
Interest
3.33
7.02
-52.56%
Exceptional Items
-0.64
0.00
Standalone Net Profit
29.00
19.46
49.02%
Operating Profit Margin (Excl OI)
9.02%
9.07%
-0.05%
Values in Rs Cr.
Direction Arrows
Net Sales

YoY Growth in year ended Mar 2026 is 12.71% vs -4.95% in Mar 2025

Direction Arrows
Standalone Net Profit

YoY Growth in year ended Mar 2026 is 49.02% vs -26.20% in Mar 2025

stock-summaryCompany CV
About Sahyadri Industries Ltd stock-summary

stock-summary
Sahyadri Industries Ltd
Micro Cap
Cement & Cement Products
Sahyadri Industries Limited was incorporated in the year 1994. The group founded by Late Shri. L. B. Patel, who ventured into the trade to timber and building materials, sensing the Urban and Rural needs for developing shelters to people of all income groups way back in 1947. The Company is engaged in the production of cement sheets and accessories, trading of steel doors and in generation of wind power electricity.
Company Coordinates stock-summary
Company Details
Swastik House 39/D Gultekadi, Jawaharlal Nehru Road Pune Maharashtra : 411037
stock-summary
Tel: 91-20-26444625/26/27
stock-summary
swastikroofing@silworld.in/info@sil
Registrar Details
Sharex Dynamic (India) Pvt Ltd , Unit -1, Luthra Ind. Premises , Safed Pool, Andheri-Kurla Road, Andheri (E), Mumbai