
Compare Shiva Cement with Similar Stocks
Dashboard
With HIgh Debt (Debt-Equity Ratio at 39.12 times)- the company has a Weak Long Term Fundamental Strength
- Poor long term growth as Net Sales has grown by an annual rate of 72.50% and Operating profit at 0% over the last 5 years
- The company is Net-Debt Free
Risky - Negative Operating Profits
Despite the size of the company, domestic mutual funds hold only 0% of the company
Consistent Underperformance against the benchmark over the last 3 years
Stock DNA
Cement & Cement Products
INR 551 Cr (Micro Cap)
NA (Loss Making)
34
0.00%
39.12
-305.68%
13.65
Total Returns (Price + Dividend) 
Shiva Cement for the last several years.
Risk Adjusted Returns v/s
Returns Beta

News
Shiva Cement Ltd is Rated Strong Sell
Shiva Cement Ltd is rated Strong Sell by MarketsMOJO, with this rating last updated on 25 August 2025. However, the analysis and financial metrics discussed here reflect the stock’s current position as of 09 June 2026, providing investors with the latest insights into the company’s performance and outlook.
Read full news article
Shiva Cement Ltd is Rated Strong Sell
Shiva Cement Ltd is rated Strong Sell by MarketsMOJO, with this rating last updated on 25 Aug 2025. However, the analysis and financial metrics discussed here reflect the stock’s current position as of 26 May 2026, providing investors with an up-to-date perspective on the company’s fundamentals, valuation, financial trends, and technical outlook.
Read full news article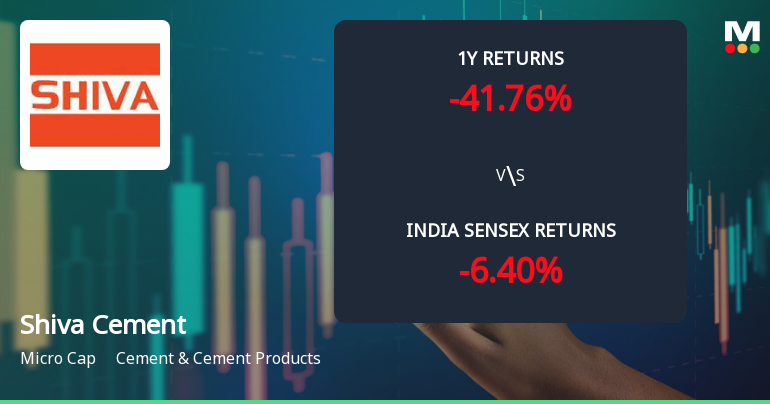
Shiva Cement Ltd Technical Momentum Shifts Amid Persistent Downtrend
Shiva Cement Ltd, a micro-cap player in the Cement & Cement Products sector, has experienced a notable shift in its technical parameters, reflecting a complex interplay of bullish and bearish signals. Despite a recent uptick in price momentum, the stock remains under pressure with a strong sell rating and a significant underperformance relative to the broader market benchmarks.
Read full news article Announcements
Shareholder Meeting / Postal Ballot-Outcome of Postal_Ballot
15-Jun-2026 | Source : BSEPursuant to Regulation 30 & 44 (3) of SEBI (LODR) Regulations 2015 attached herewith is the outcome of the Postal Ballot Notice Dated 14th May 2026.
Shareholder Meeting / Postal Ballot-Scrutinizers Report
15-Jun-2026 | Source : BSEPursuant to Regulation 30 & 44 (3) of SEBI (LODR) Regulations 2015 attached herewith is the scrutinizers Report for the Postal Ballot Notice Dated 14th May 2026.
Compliances-Reg.24(A)-Annual Secretarial Compliance
26-May-2026 | Source : BSEPlease find attached herewith the Annual Secretarial Compliance Report for the FY 2025-26
Corporate Actions

No Upcoming Board Meetings

No Dividend history available

No Splits history available

Shiva Cement Ltd has announced 1:10 bonus issue, ex-date: 09 Dec 10

Shiva Cement Ltd has announced 20:39 rights issue, ex-date: 03 Apr 24
Quality key factors
Valuation key factors
Technicals key factors
 Technical Indicator Scale: Bearish, Mildly Bearish, Sideways, Mildly Bullish, Bullish Turned
 Shareholding Snapshot : Mar 2026
Shareholding Compare (%holding)
Promoters
None
Held by 0 Schemes
Held by 1 FIIs (0.11%)
Jsw Cement Limited (66.17%)
Celsia Philomena Bocarro (1.03%)
28.25%
Quarterly Results Snapshot (Standalone) - Mar'26 - QoQ

QoQ Growth in quarter ended Mar 2026 is -3.75% vs 53.56% in Dec 2025

QoQ Growth in quarter ended Mar 2026 is 15.55% vs -3.57% in Dec 2025
Half Yearly Results Snapshot (Standalone) - Sep'25
Growth in half year ended Sep 2025 is 27.58% vs 40.90% in Sep 2024
Growth in half year ended Sep 2025 is -14.02% vs -129.49% in Sep 2024
Nine Monthly Results Snapshot (Standalone) - Dec'25
YoY Growth in nine months ended Dec 2025 is 53.21% vs 1.26% in Dec 2024
YoY Growth in nine months ended Dec 2025 is -8.57% vs -57.95% in Dec 2024
Annual Results Snapshot (Standalone) - Mar'26
YoY Growth in year ended Mar 2026 is 39.85% vs -10.28% in Mar 2025
YoY Growth in year ended Mar 2026 is 11.90% vs -108.55% in Mar 2025
About Shiva Cement Ltd

Company Coordinates


