
Compare Kwality Pharma with Similar Stocks
Dashboard
Strong ability to service debt as the company has a low Debt to EBITDA ratio of 1.10 times
With a growth in Net Profit of 74.79%, the company declared Very Positive results in Mar 26
Increasing Participation by Institutional Investors
Consistent Returns over the last 3 years
Stock DNA
Pharmaceuticals & Biotechnology
INR 2,744 Cr (Micro Cap)
37.00
24
0.00%
0.38
20.49%
7.62
Total Returns (Price + Dividend) 
Latest dividend: 0.6 per share ex-dividend date: Jan-05-2017
Risk Adjusted Returns v/s
Returns Beta

News
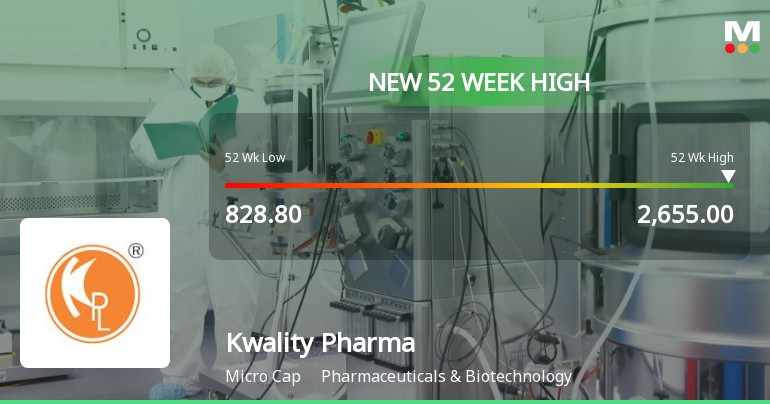
Broad-Based Technical Strength Lifts Kwality Pharmaceuticals Ltd to 52-Week High of Rs 2655
Surging past its previous peaks, Kwality Pharmaceuticals Ltd touched a new 52-week high of Rs 2655 on 29 Jun 2026, marking a remarkable 155.09% gain over the past year. This milestone comes amid a backdrop of strong technical momentum and sustained outperformance relative to the broader market.
Read full news article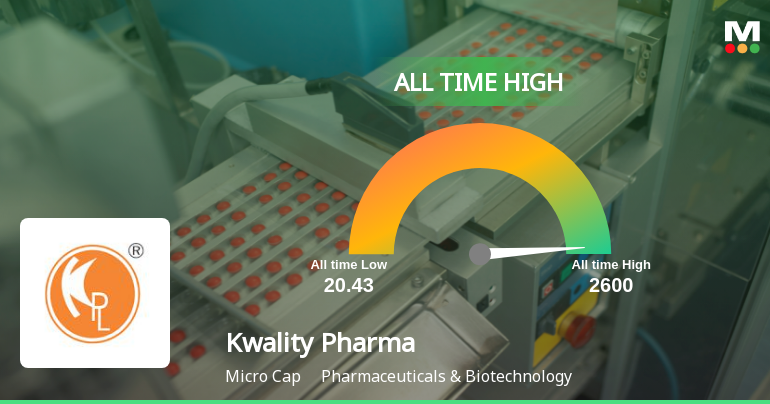
Kwality Pharmaceuticals Ltd Hits All-Time High of Rs 2,650 as Momentum Builds Across Timeframes
Extending its remarkable rally, Kwality Pharmaceuticals Ltd surged 9.04% on 29 Jun 2026 to close at a fresh all-time high of Rs 2,650, significantly outperforming the Sensex which slipped 0.04% on the day.
Read full news article
Kwality Pharmaceuticals Ltd is Rated Buy by MarketsMOJO
Kwality Pharmaceuticals Ltd is rated 'Buy' by MarketsMOJO, with this rating last updated on 29 January 2026. However, the analysis and financial metrics discussed here reflect the stock's current position as of 22 June 2026, providing investors with an up-to-date view of the company's fundamentals, returns, and market performance.
Read full news article Announcements
Announcement under Regulation 30 (LODR)-Change in Management
02-Jun-2026 | Source : BSEAppointment of Mr. Swanith Kapoor as Additional (Non-Executive Independent) Director and Resignation of Mr. Kartik Kapur Independent Director of the Company.
Announcement under Regulation 30 (LODR)-Resignation of Director
02-Jun-2026 | Source : BSEResignation of Mr. Kartik Kapur Independent Director of the Company.
Compliances-Reg.24(A)-Annual Secretarial Compliance
30-May-2026 | Source : BSEAnnual Secretarial Compliance Report for the year ended 31-03-2026 is enclosed herewith
Corporate Actions

No Upcoming Board Meetings

Kwality Pharmaceuticals Ltd has declared 6% dividend, ex-date: 05 Jan 17

No Splits history available

Kwality Pharmaceuticals Ltd has announced 1:1 bonus issue, ex-date: 11 Oct 17

No Rights history available
Quality key factors
Valuation key factors
Technicals key factors
 Technical Indicator Scale: Bearish, Mildly Bearish, Sideways, Mildly Bullish, Bullish Turned
 Shareholding Snapshot : Mar 2026
Shareholding Compare (%holding)
Promoters
None
Held by 2 Schemes (0.0%)
Held by 6 FIIs (2.79%)
Ramesh Arora (26.03%)
Deepak Bansal (9.24%)
31.64%
Quarterly Results Snapshot (Consolidated) - Mar'26 - YoY

YoY Growth in quarter ended Mar 2026 is 35.81% vs 25.77% in Mar 2025

YoY Growth in quarter ended Mar 2026 is 74.60% vs 232.34% in Mar 2025
Half Yearly Results Snapshot (Consolidated) - Sep'25
Growth in half year ended Sep 2025 is 30.82% vs 24.08% in Sep 2024
Growth in half year ended Sep 2025 is 54.72% vs 44.34% in Sep 2024
Nine Monthly Results Snapshot (Consolidated) - Dec'25
YoY Growth in nine months ended Dec 2025 is 35.93% vs 18.27% in Dec 2024
YoY Growth in nine months ended Dec 2025 is 65.81% vs 31.06% in Dec 2024
Annual Results Snapshot (Consolidated) - Mar'26
YoY Growth in year ended Mar 2026 is 35.89% vs 20.52% in Mar 2025
YoY Growth in year ended Mar 2026 is 69.01% vs 67.44% in Mar 2025
About Kwality Pharmaceuticals Ltd

Company Coordinates


