Kwality Pharma

  • Market Cap: Small Cap
  • Industry: Pharmaceuticals & Biotechnology
  • ISIN: INE552U01010
  • NSEID: KPL
  • BSEID: 539997
INR
3,747.50
-89.4 (-2.33%)
BSENSE

Sep 22, 02:59 PM

BSE+NSE Vol: 49.77 k

  • Price Points
  • Score
  • Mojo Parameters
  • Total Return
  • News and Corporate Actions
  • Key factors
  • Shareholding
  • Financials
  • CompanyCV
stock-summaryPrice Point
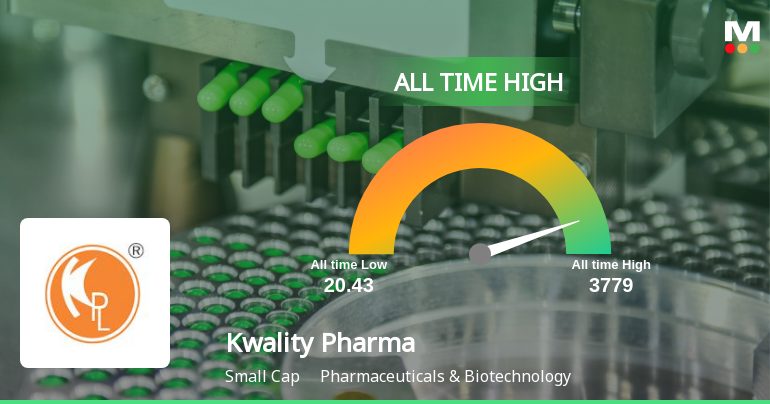
High/Low

1Day

52 Week

Valuation
Technical
Day's Volume

CASH

49.77 k (-25.38%) Volume

Shareholding (Jun 2026)

FII

3.13%

Held by 5 FIIs

DII

0.56%

Held by 0 DIIs

Promoter

54.86%

Why is Kwality Pharmaceuticals Ltd falling/rising?

06-Sep-2026

As of 05-Sep, Kwality Pharmaceuticals Ltd's stock is experiencing a decline of 1.47%, following a two-day drop of 3.07%. Despite strong financial performance and long-term gains, current market sentiment and reduced investor participation are driving the stock's downward trend.

As of 05-Sep, Kwality Pharmaceuticals Ltd's stock price is currently falling, with a change of -49.05, representing a decrease of 1.47%. This decline follows a trend where the stock has been losing for the last two days, resulting in a total drop of 3.07% during this period. Despite opening with a gain of 2.45% today and reaching an intraday high of Rs 3424.95, the stock also touched a low of Rs 3232.15, indicating significant volatility within the trading day.<BR><BR>The stock's performance today has underperformed the sector by 1.23%, and there has been a decrease in investor participation, with delivery volume falling by 8.26% against the five-day average. Although the company has shown strong financial results, including a 114.93% growth in net profit and consistent positive results over the last ten quarters, these factors have not been sufficient to prevent the recent decline in stock price. <BR><BR>Overall, while Kwality Pharmaceuticals Ltd has demonstrated impressive long-term returns, including a 254.09% increase over the past year, the current market sentiment and recent trading activity are contributing to the stock's downward movement.

View full answer

Should I buy, sell or hold Kwality Pharmaceuticals Ltd?

02-Sep-2026

Who are in the management team of Kwality Pharma?

01-Sep-2026

The management team of Kwality Pharma includes Ramesh Arora (Managing Director), Ajay Arora, Geeta Arora, Anju Arora, Aditya Arora (CFO), and several independent directors, along with Gurpreet Kaur (Company Secretary) and Sachin Seth (Director), bringing diverse expertise to the company.

The management team of Kwality Pharma includes the following individuals:<BR><BR>1. Ramesh Arora - Managing Director<BR>2. Ajay Arora - Whole-time Director<BR>3. Geeta Arora - Whole-time Director<BR>4. Anju Arora - Whole-time Director<BR>5. Aditya Arora - Whole Time Director & CFO<BR>6. Ravi Shanker Singh - Independent Director<BR>7. Pankaj Takkar - Independent Director<BR>8. Kiran Kumar Verma - Independent Director<BR>9. Kartik Kapur - Independent Director<BR>10. Gurpreet Kaur - Company Secretary & Compliance Officer<BR>11. Sachin Seth - Director<BR><BR>This diverse team brings a range of expertise and leadership to the company.

View full answer

What does Kwality Pharma do?

01-Sep-2026

Kwality Pharmaceuticals Ltd is a small-cap company in the Pharmaceuticals & Biotechnology industry, specializing in finished pharmaceuticals. As of June 2026, it reported net sales of 162 Cr and a net profit of 26 Cr, with a market cap of INR 3,376 Cr.

Overview: <BR>Kwality Pharmaceuticals Ltd is a small-cap company operating in the Pharmaceuticals & Biotechnology industry, specializing in the manufacturing of finished pharmaceuticals.<BR><BR>History: <BR>Kwality Pharmaceuticals Ltd was incorporated on May 4th, 1983. The company received its first drug license in 1981 for liquid oral manufacturing. The latest quarterly results reported net sales and net profit for June 2026.<BR><BR>Financial Snapshot: <BR>Net Sales: 162 Cr (Quarterly Results - Jun 2026) <BR>Net Profit: 26 Cr (Quarterly Results - Jun 2026) <BR>Market Cap: INR 3,376 Cr (Small Cap)<BR><BR>Key Metrics: <BR>P/E: 42.00 <BR>Industry P/E: 37 <BR>Dividend Yield: 0.00% <BR>Debt Equity: 0.38 <BR>Return on Equity: 20.49% <BR>Price to Book: 10.34<BR><BR>Contact Details: <BR>Address: Village Nagkalan, Majitha Road Amritsar Punjab : 143601 <BR>Tel: 91-183-2774321-25 <BR>Email: cs@kwalitypharma.com <BR>Website: http://www.kwalitypharma.com

View full answer

Who are the peers of the Kwality Pharma?

01-Sep-2026

Kwality Pharma's peers include Unichem Labs, Aarti Drugs, Novartis India, and several others. In terms of management risk, Novartis India is rated excellent, while growth is good for Unichem Labs and Novartis India; Kwality Pharma has a 1-year return of 231.75%.

Peers: The peers of Kwality Pharma are Unichem Labs., Aarti Drugs, Novartis India, SMS Pharma., Advanced Enzyme, Ind-Swift Labs., Solara Active, Dishman Carbogen, Hikal, and Zota Health Care.<BR><BR>Quality Snapshot: Excellent management risk is observed at Novartis India, while Average management risk is found at Unichem Labs., Aarti Drugs, SMS Pharma., Advanced Enzyme, and Hikal, and the rest have Below Average management risk. Growth is rated as Good for Unichem Labs. and Novartis India, while Below Average growth is noted for Aarti Drugs, Kwality Pharma, SMS Pharma., Advanced Enzyme, Ind-Swift Labs., Solara Active, Hikal, and the rest. In terms of Capital Structure, Excellent ratings are given to Novartis India and Advanced Enzyme, Good to Aarti Drugs and Unichem Labs., Average to SMS Pharma. and Ind-Swift Labs., and Below Average to Solara Active, Dishman Carbogen, Hikal, and Zota Health Care.<BR><BR>Return Snapshot: Ind-Swift Labs. has the highest 1-year return at 278.73%, while Aarti Drugs has the lowest at -12.04%. Kwality Pharma's 1-year return of 231.75% is significantly higher than Aarti Drugs. Additionally, Advanced Enzyme, Dishman Carbogen, Hikal, and Zota Health Care have negative six-month returns.

View full answer

How big is Kwality Pharma?

01-Sep-2026

As of 31st August, Kwality Pharmaceuticals Ltd has a market capitalization of 3,376.00 Cr, with recent net sales of 553.95 Cr and a net profit of 81.05 Cr.

As of 31st August, Kwality Pharmaceuticals Ltd has a market capitalization of 3,376.00 Cr, categorizing it as a Small Cap company.<BR><BR>In the latest 4 quarters, the company reported Net Sales of 553.95 Cr and a Net Profit of 81.05 Cr.<BR><BR>The latest annual period for the balance sheet is March 2026, with Shareholder's Funds amounting to 331.60 Cr and Total Assets of 589.71 Cr.

View full answer

When is the next results date for Kwality Pharmaceuticals Ltd?

04-Aug-2026

The next results date for Kwality Pharmaceuticals Ltd is 10 August 2026.

The next results date for Kwality Pharmaceuticals Ltd is scheduled for 10 August 2026.

View full answer

Are Kwality Pharmaceuticals Ltd latest results good or bad?

20-May-2026

Kwality Pharmaceuticals Ltd's latest Q4 FY26 results are very good, with a net profit of ₹25.30 crore, up 74.60% year-on-year, and revenue growth of 35.81%. The stock price surged nearly 9% post-announcement, indicating strong investor confidence.

Kwality Pharmaceuticals Ltd's latest results for Q4 FY26 are quite impressive, indicating strong performance. The company reported a net profit of ₹25.30 crore, which reflects a remarkable year-on-year growth of 74.60% and a quarter-on-quarter increase of 58.03%. Revenue also saw significant growth, reaching ₹157.11 crore, up 35.81% year-on-year and 27.28% sequentially.<BR><BR>Furthermore, the operating margin improved to 24.66%, marking the highest quarterly margin recorded, and the profit after tax (PAT) margin expanded to 16.11%, up 360 basis points from the previous year. This demonstrates not only robust revenue growth but also enhanced operational efficiency.<BR><BR>The stock market reacted positively to these results, with the share price surging nearly 9% shortly after the announcement, reflecting growing investor confidence in the company's trajectory. Overall, these results can be characterized as very good, showcasing strong financial health and operational excellence.

View full answer

Is Kwality Pharma technically bullish or bearish?

04-Dec-2025

As of December 3, 2025, Kwality Pharma's technical trend is bearish with moderate strength, driven by bearish MACD and moving averages, despite a mildly bullish indication from Bollinger Bands on the monthly timeframe.

As of 3 December 2025, the technical trend has changed from mildly bearish to bearish. The current technical stance for Kwality Pharma is bearish with a moderate strength. Key indicators driving this stance include a bearish MACD on the weekly timeframe, bearish moving averages on the daily timeframe, and a bearish KST on the weekly. The Bollinger Bands indicate a mildly bullish trend on the monthly, but overall, the prevailing bearish signals dominate the analysis.

View full answer

How has been the historical performance of Kwality Pharma?

03-Dec-2025

Kwality Pharma's historical performance shows fluctuating trends, with net sales increasing from 251.03 Cr in Mar'23 to 370.20 Cr in Mar'25, despite a peak of 456.19 Cr in Mar'22. While operating profit and net income improved, the volatility in sales and profit margins indicates a need for strategic stability.

Answer:<BR>The historical performance of Kwality Pharma shows a fluctuating trend in its financial metrics over the years, with notable changes in revenue and profitability.<BR><BR>Breakdown:<BR>Kwality Pharma's net sales increased from 251.03 Cr in Mar'23 to 370.20 Cr in Mar'25, reflecting a significant growth trajectory. However, this growth follows a peak in Mar'22 at 456.19 Cr, indicating volatility in sales performance. Total operating income mirrored this trend, rising to 370.20 Cr in Mar'25 from 251.03 Cr in Mar'23, while total expenditure also increased to 289.81 Cr in Mar'25 from 190.89 Cr in Mar'23. Operating profit, excluding other income, improved to 80.39 Cr in Mar'25, up from 60.14 Cr in Mar'23, although it was significantly higher at 171.67 Cr in Mar'22. Profit before tax also saw an increase to 54.14 Cr in Mar'25 from 25.57 Cr in Mar'23, while profit after tax rose to 39.80 Cr in Mar'25 from 19.28 Cr in Mar'23. The company's total assets grew to 445.66 Cr in Mar'25 from 353.63 Cr in Mar'23, alongside total liabilities which increased to 445.66 Cr from 394.18 Cr in the same period. Cash flow from operating activities improved to 52.00 Cr in Mar'25 from 41.00 Cr in Mar'23, contributing to a net cash inflow of 9.00 Cr in Mar'25, compared to an outflow of 6.00 Cr in Mar'23. Overall, while Kwality Pharma has shown growth in several key areas, the fluctuations in sales and profit margins suggest a need for strategic stability moving forward.

View full answer

Is Kwality Pharma overvalued or undervalued?

17-Nov-2025

As of November 14, 2025, Kwality Pharma is considered undervalued with a favorable valuation grade, reflected in its PE ratio of 20.24 and strong recent stock performance, especially compared to more expensive peers like Sun Pharma and Divi's Lab.

As of 14 November 2025, the valuation grade for Kwality Pharma has moved from fair to attractive, indicating a positive shift in its market perception. The company is currently considered undervalued based on its key financial ratios, including a PE ratio of 20.24, an EV to EBITDA of 11.51, and a PEG ratio of 0.45, which suggests strong growth potential relative to its price. <BR><BR>In comparison to its peers, Kwality Pharma's valuation appears favorable; for instance, Sun Pharma has a PE ratio of 36.49, while Divi's Lab shows a significantly higher PE of 69.65, both categorizing them as expensive. Additionally, Cipla, which is also rated attractive, has a PE ratio of 22.72, further highlighting Kwality Pharma's relative value. The company's recent stock performance has outpaced the Sensex, with a 1-week return of 11.37% compared to the Sensex's 1.62%, reinforcing the argument for its undervaluation.

View full answer

Who are the top shareholders of the Kwality Pharma?

17-Jul-2025

The top shareholders of Kwality Pharma are Ramesh Arora, holding 26.01%, and Deepak Bansal, with 10.63%. Individual investors collectively own 33.39%, while there are no mutual funds or foreign institutional investors involved.

The top shareholders of Kwality Pharma include Ramesh Arora, who is the promoter with the highest holding at 26.01%. The highest public shareholder is Deepak Bansal, holding 10.63%. Additionally, individual investors collectively hold 33.39% of the company's shares. There are currently no mutual funds or foreign institutional investors (FIIs) holding shares in the company.

View full answer

What is the bonus history of the Kwality Pharma?

06-Jun-2025

Kwality Pharma announced a 1:1 bonus issue on October 11, 2017, with a record date of October 12, 2017, allowing shareholders to receive one additional share for each share held.

Kwality Pharma has a bonus history that includes a significant event where the company announced a 1:1 bonus issue. This bonus was declared with an ex-date of October 11, 2017, and the record date was October 12, 2017. This means that shareholders on record as of the record date were entitled to receive one additional share for every share they held.

View full answer

Has Kwality Pharma declared dividend?

06-Jun-2025

Kwality Pharmaceuticals Ltd has declared a 6% dividend, amounting to 0.6 per share, with an ex-date of January 5, 2017. Despite this, the dividend yield is 0%, as the company has shown substantial price returns over various periods without ongoing dividend payments.

Kwality Pharmaceuticals Ltd has declared a 6% dividend.<BR><BR>Dividend Details:<BR>- Percentage announced: 6%<BR>- Amount per share: 0.6<BR>- Ex-date: 05 Jan 17<BR><BR>Dividend Yield: 0%<BR><BR>Total Returns by Period:<BR>In the 6 months period, the price return was 5.03%, the dividend return was 0%, resulting in a total return of 5.03%.<BR><BR>For the 1 year period, the price return was 73.5%, the dividend return was 0%, leading to a total return of 73.5%.<BR><BR>Over the 2 years period, the price return was 214.76%, the dividend return was 0%, which culminated in a total return of 214.76%.<BR><BR>In the 3 years period, the price return was 148.67%, the dividend return was 0%, resulting in a total return of 148.67%.<BR><BR>For the 4 years period, the price return was 794.74%, the dividend return was 0%, leading to a total return of 794.74%.<BR><BR>In the 5 years period, the price return was 2571.43%, the dividend return was 0%, culminating in a total return of 2571.43%.<BR><BR>Overall, while Kwality Pharmaceuticals Ltd declared a dividend, the dividend yield remains at 0%. The company has shown significant price returns over various periods, indicating strong growth despite the lack of ongoing dividend payments.

View full answer
iScoreScore
Part of MojoOne Strategy
Click here to find our call on this stock
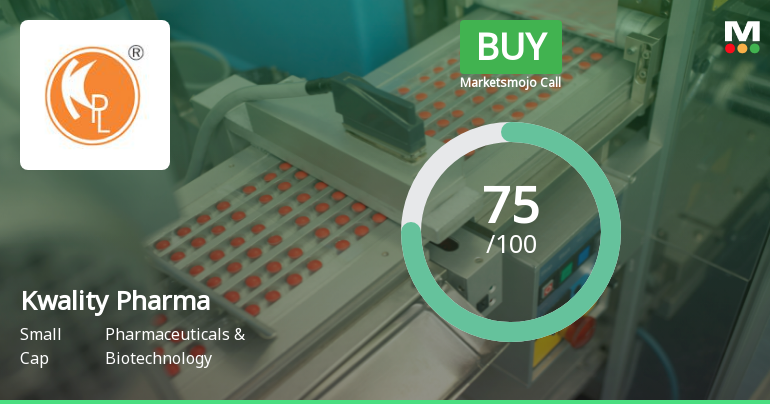
Strong Sell
Sell
Hold
Buy
Strong Buy

Dashboard

1

Strong ability to service debt as the company has a low Debt to EBITDA ratio of 1.10 times

 
2

With a growth in Net Profit of 114.93%, the company declared Outstanding results in Jun 26

3

Increasing Participation by Institutional Investors

4

Consistent Returns over the last 3 years

stock-summaryMojo Parameters

Mojo Parameters

Loading Valuation Snapshot...

Stock DNA

stock-summary
Industry

Pharmaceuticals & Biotechnology

stock-summary
Market cap

INR 3,888 Cr (Small Cap)

stock-summary
P/E

49.00

stock-summary
Industry P/E

38

stock-summary
Dividend Yield

0.00%

stock-summary
Debt Equity

0.38

stock-summary
Return on Equity

20.49%

stock-summary
Price to Book

12.01

Revenue and Profits:
Net Sales:
162 Cr
(Quarterly Results - Jun 2026)
Net Profit:
26 Cr
stock-summaryTotal Returns
Total Returns (Price + Dividend) stock-summary
Dividend Yield (0%)
TimePeriod
Price Return
Dividend Return
Total Return
3 Months
54.62%
0%
54.62%
6 Months
146.9%
0%
146.9%
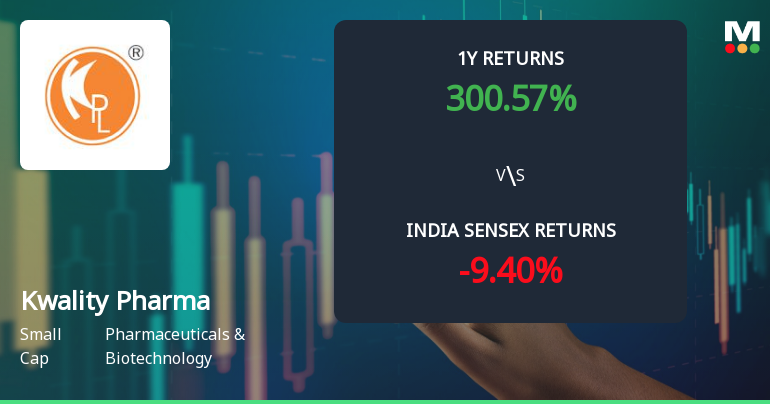
1 Year
298.65%
0%
298.65%
2 Years
375.36%
0%
375.36%
3 Years
943.29%
0%
943.29%
4 Years
716.72%
0%
716.72%
5 Years
499.84%
0%
499.84%

Latest dividend: 0.3 per share ex-dividend date: Jan-05-2017

Risk Adjusted Returns v/s stock-summary
Returns Beta
Icon
Beta has not been calculated since enough price history is not available
stock-summaryNews & Corporate Actions

News

Announcements stock-summary

Shareholder Meeting / Postal Ballot-Scrutinizers Report

02-Sep-2026 | Source : BSE

SCRUTINIZER REPORT OF AGM E-VOTING IS ATTACHED

Announcement under Regulation 30 (LODR)-Change in Management

02-Sep-2026 | Source : BSE

Regularization of appointment of Mr Swanith Kapoor as Director and reappointment of Mr Aditya Arora as WTD of the company

Shareholder Meeting / Postal Ballot-Outcome of AGM

31-Aug-2026 | Source : BSE

Proceedings of 43rd Annual General Meeting attached herewith.

Corporate Actions stock-summary

stock-summary
BOARD MEETING

No Upcoming Board Meetings

stock-summary
DIVIDEND

Kwality Pharmaceuticals Ltd has declared 6% dividend, ex-date: 05 Jan 17

stock-summary
SPLITS

No Splits history available

stock-summary
BONUS

Kwality Pharmaceuticals Ltd has announced 1:1 bonus issue, ex-date: 11 Oct 17

stock-summary
RIGHTS

No Rights history available

stock-summaryKey Factors

Quality key factors stock-summary

Factor
Value
Sales Growth (5y)
8.06%
EBIT Growth (5y)
-3.09%
EBIT to Interest (avg)
13.08
Debt to EBITDA (avg)
1.14
Net Debt to Equity (avg)
0.38
Sales to Capital Employed (avg)
0.98
Tax Ratio
23.86%
Dividend Payout Ratio
0
Pledged Shares
0
Institutional Holding
3.69%
ROCE (avg)
17.72%
ROE (avg)
77.82%

Valuation key factors

Factor
Value
P/E Ratio
49
Industry P/E
38
Price to Book Value
12.01
EV to EBIT
35.71
EV to EBITDA
30.42
EV to Capital Employed
8.96
EV to Sales
7.42
PEG Ratio
0.55
Dividend Yield
NA
ROCE (Latest)
21.47%
ROE (Latest)
20.49%

Technicals key factors

Indicator
Weekly
Monthly
MACD
Bullish
Bullish
RSI
Bearish
Bearish
Bollinger Bands
Bullish
Bullish
Moving Averages
Bullish (Daily)
KST
Mildly Bearish
Bullish
Dow Theory
Bullish
Bullish
OBV
No Trend
No Trend
stock-summary Technical Indicator Scale: Bearish, Mildly Bearish, Sideways, Mildly Bullish, Bullish  Turned 
stock-summaryShareholding
Shareholding Snapshot : Jun 2026stock-summary
Shareholding Compare (%holding) stock-summary
Majority shareholders

Promoters

Pledged Promoter Holdings

None

Mutual Funds

Held by 2 Schemes (0.0%)

FIIs

Held by 5 FIIs (3.13%)

Promoter with highest holding

Ramesh Arora (26.03%)

Highest Public shareholder

Deepak Bansal (8.39%)

Individual Investors Holdings

31.03%

stock-summaryFinancial
[
  {
    "link": "quarterly",
    "btn_text": "All Quarterly Results",
    "header": "Quarterly Results Snapshot (Consolidated) - Jun'26 - YoY",
    "rhs": [
      {
        "prefix": "Net Sales ",
        "suffix": "YoY Growth in quarter ended Jun 2026 is 45.63% vs 39.21% in Jun 2025",
        "dir": 1
      },
      {
        "prefix": "Consolidated Net Profit ",
        "suffix": "YoY Growth in quarter ended Jun 2026 is 114.75% vs 42.70% in Jun 2025",
        "dir": 1
      }
    ],
    "table": {
      "header": [
        "Jun'26",
        "Jun'25",
        "Change(%)"
      ],
      "body": [
        {
          "field": "Net Sales",
          "val1": "162.35",
          "val2": "111.48",
          "chgp": "45.63%",
          "chgp_class": "positive"
        },
        {
          "field": "Operating Profit (PBDIT) excl Other Income",
          "val1": "41.01",
          "val2": "24.17",
          "chgp": "69.67%",
          "chgp_class": "positive"
        },
        {
          "field": "Interest",
          "val1": "2.66",
          "val2": "2.76",
          "chgp": "-3.62%",
          "chgp_class": "positive"
        },
        {
          "field": "Exceptional Items",
          "val1": "0.00",
          "val2": "0.00",
          "chgp": "",
          "chgp_class": "neutral"
        },
        {
          "field": "Consolidate Net Profit",
          "val1": "25.62",
          "val2": "11.93",
          "chgp": "114.75%",
          "chgp_class": "positive"
        },
        {
          "field": "Operating Profit Margin (Excl OI)",
          "val1": "25.26%",
          "val2": "21.68%",
          "chgp": "3.58%",
          "chgp_class": "positive"
        }
      ]
    }
  },
  {
    "link": "half-yearly",
    "btn_text": "All Half Yearly Results",
    "header": "Half Yearly Results Snapshot (Consolidated) - Sep'25",
    "rhs": [
      {
        "prefix": "Net Sales ",
        "suffix": " Growth in half year ended Sep 2025 is 30.82% vs 24.08% in Sep 2024",
        "dir": 1
      },
      {
        "prefix": "Consolidated Net Profit ",
        "suffix": " Growth in half year ended Sep 2025 is 54.72% vs 44.34% in Sep 2024",
        "dir": 1
      }
    ],
    "table": {
      "header": [
        "Sep'25",
        "Sep'24",
        "Change(%)"
      ],
      "body": [
        {
          "field": "Net Sales",
          "val1": "222.53",
          "val2": "170.11",
          "chgp": "30.82%",
          "chgp_class": "positive"
        },
        {
          "field": "Operating Profit (PBDIT) excl Other Income",
          "val1": "49.53",
          "val2": "37.00",
          "chgp": "33.86%",
          "chgp_class": "positive"
        },
        {
          "field": "Interest",
          "val1": "5.60",
          "val2": "5.18",
          "chgp": "8.11%",
          "chgp_class": "negative"
        },
        {
          "field": "Exceptional Items",
          "val1": "0.00",
          "val2": "0.00",
          "chgp": "",
          "chgp_class": "neutral"
        },
        {
          "field": "Consolidate Net Profit",
          "val1": "26.04",
          "val2": "16.83",
          "chgp": "54.72%",
          "chgp_class": "positive"
        },
        {
          "field": "Operating Profit Margin (Excl OI)",
          "val1": "22.26%",
          "val2": "21.75%",
          "chgp": "0.51%",
          "chgp_class": "positive"
        }
      ]
    }
  },
  {
    "link": "nine-monthly",
    "btn_text": "All Nine Monthly Results",
    "header": "Nine Monthly Results Snapshot (Consolidated) - Dec'25",
    "rhs": [
      {
        "prefix": "Net Sales ",
        "suffix": "YoY Growth in nine months ended Dec 2025 is 35.93% vs 18.27% in Dec 2024",
        "dir": 1
      },
      {
        "prefix": "Consolidated Net Profit ",
        "suffix": "YoY Growth in nine months ended Dec 2025 is 65.81% vs 31.06% in Dec 2024",
        "dir": 1
      }
    ],
    "table": {
      "header": [
        "Dec'25",
        "Dec'24",
        "Change(%)"
      ],
      "body": [
        {
          "field": "Net Sales",
          "val1": "345.97",
          "val2": "254.52",
          "chgp": "35.93%",
          "chgp_class": "positive"
        },
        {
          "field": "Operating Profit (PBDIT) excl Other Income",
          "val1": "79.48",
          "val2": "54.50",
          "chgp": "45.83%",
          "chgp_class": "positive"
        },
        {
          "field": "Interest",
          "val1": "8.08",
          "val2": "7.38",
          "chgp": "9.49%",
          "chgp_class": "negative"
        },
        {
          "field": "Exceptional Items",
          "val1": "-0.83",
          "val2": "0.00",
          "chgp": "",
          "chgp_class": "neutral"
        },
        {
          "field": "Consolidate Net Profit",
          "val1": "42.05",
          "val2": "25.36",
          "chgp": "65.81%",
          "chgp_class": "positive"
        },
        {
          "field": "Operating Profit Margin (Excl OI)",
          "val1": "22.97%",
          "val2": "21.41%",
          "chgp": "1.56%",
          "chgp_class": "positive"
        }
      ]
    }
  },
  {
    "link": "annual",
    "btn_text": "All Annual Results",
    "header": "Annual Results Snapshot (Consolidated) - Mar'26",
    "rhs": [
      {
        "prefix": "Net Sales ",
        "suffix": "YoY Growth in year ended Mar 2026 is 35.89% vs 20.52% in Mar 2025",
        "dir": 1
      },
      {
        "prefix": "Consolidated Net Profit ",
        "suffix": "YoY Growth in year ended Mar 2026 is 69.01% vs 67.44% in Mar 2025",
        "dir": 1
      }
    ],
    "table": {
      "header": [
        "Mar'26",
        "Mar'25",
        "Change(%)"
      ],
      "body": [
        {
          "field": "Net Sales",
          "val1": "503.08",
          "val2": "370.20",
          "chgp": "35.89%",
          "chgp_class": "positive"
        },
        {
          "field": "Operating Profit (PBDIT) excl Other Income",
          "val1": "118.24",
          "val2": "80.39",
          "chgp": "47.08%",
          "chgp_class": "positive"
        },
        {
          "field": "Interest",
          "val1": "10.97",
          "val2": "9.88",
          "chgp": "11.03%",
          "chgp_class": "negative"
        },
        {
          "field": "Exceptional Items",
          "val1": "-0.83",
          "val2": "0.00",
          "chgp": "",
          "chgp_class": "neutral"
        },
        {
          "field": "Consolidate Net Profit",
          "val1": "67.35",
          "val2": "39.85",
          "chgp": "69.01%",
          "chgp_class": "positive"
        },
        {
          "field": "Operating Profit Margin (Excl OI)",
          "val1": "23.50%",
          "val2": "21.72%",
          "chgp": "1.78%",
          "chgp_class": "positive"
        }
      ]
    }
  }
]

Quarterly Results Snapshot (Consolidated) - Jun'26 - YoYstock-summary

Jun'26
Jun'25
Change(%)
Net Sales
162.35
111.48
45.63%
Operating Profit (PBDIT) excl Other Income
41.01
24.17
69.67%
Interest
2.66
2.76
-3.62%
Exceptional Items
0.00
0.00
Consolidate Net Profit
25.62
11.93
114.75%
Operating Profit Margin (Excl OI)
25.26%
21.68%
3.58%
Values in Rs Cr.
Direction Arrows
Net Sales

YoY Growth in quarter ended Jun 2026 is 45.63% vs 39.21% in Jun 2025

Direction Arrows
Consolidated Net Profit

YoY Growth in quarter ended Jun 2026 is 114.75% vs 42.70% in Jun 2025

Half Yearly Results Snapshot (Consolidated) - Sep'25stock-summary

Sep'25
Sep'24
Change(%)
Net Sales
222.53
170.11
30.82%
Operating Profit (PBDIT) excl Other Income
49.53
37.00
33.86%
Interest
5.60
5.18
8.11%
Exceptional Items
0.00
0.00
Consolidate Net Profit
26.04
16.83
54.72%
Operating Profit Margin (Excl OI)
22.26%
21.75%
0.51%
Values in Rs Cr.
Direction Arrows
Net Sales

Growth in half year ended Sep 2025 is 30.82% vs 24.08% in Sep 2024

Direction Arrows
Consolidated Net Profit

Growth in half year ended Sep 2025 is 54.72% vs 44.34% in Sep 2024

Nine Monthly Results Snapshot (Consolidated) - Dec'25stock-summary

Dec'25
Dec'24
Change(%)
Net Sales
345.97
254.52
35.93%
Operating Profit (PBDIT) excl Other Income
79.48
54.50
45.83%
Interest
8.08
7.38
9.49%
Exceptional Items
-0.83
0.00
Consolidate Net Profit
42.05
25.36
65.81%
Operating Profit Margin (Excl OI)
22.97%
21.41%
1.56%
Values in Rs Cr.
Direction Arrows
Net Sales

YoY Growth in nine months ended Dec 2025 is 35.93% vs 18.27% in Dec 2024

Direction Arrows
Consolidated Net Profit

YoY Growth in nine months ended Dec 2025 is 65.81% vs 31.06% in Dec 2024

Annual Results Snapshot (Consolidated) - Mar'26stock-summary

Mar'26
Mar'25
Change(%)
Net Sales
503.08
370.20
35.89%
Operating Profit (PBDIT) excl Other Income
118.24
80.39
47.08%
Interest
10.97
9.88
11.03%
Exceptional Items
-0.83
0.00
Consolidate Net Profit
67.35
39.85
69.01%
Operating Profit Margin (Excl OI)
23.50%
21.72%
1.78%
Values in Rs Cr.
Direction Arrows
Net Sales

YoY Growth in year ended Mar 2026 is 35.89% vs 20.52% in Mar 2025

Direction Arrows
Consolidated Net Profit

YoY Growth in year ended Mar 2026 is 69.01% vs 67.44% in Mar 2025

stock-summaryCompany CV
About Kwality Pharmaceuticals Ltd stock-summary
stock-summary
Kwality Pharmaceuticals Ltd
Small Cap
Pharmaceuticals & Biotechnology
Kwality Pharmaceuticals Limited was Incorporated on May 4th 1983 when its founder Mr. Ramesh Arora was inspired to begin his own venture leaving behind the already flourishing family business of spinning and aromatics. With little background of finished pharmaceuticals and high held spirits and will, he started this business. He received his first drug license in 1981 approved for liquid oral manufacturing. Presently, the Company has 65 different sections available at their production centres.
Company Coordinates stock-summary
Company Details
Village Nagkalan, Majitha Road Amritsar Punjab : 143601
stock-summary
Tel: 91-183-2774321-25
stock-summary
cs@kwalitypharma.com
Registrar Details
Bigshare Services Pvt Ltd , E-2 , Ansa Industrial Estate, Saki Vihar Road, Saki Naka, Andheri (E), Mumbai