
Compare Solara Active with Similar Stocks
Dashboard
Weak Long Term Fundamental Strength with a -20.67% CAGR growth in Operating Profits over the last 5 years
- Low ability to service debt as the company has a high Debt to EBITDA ratio of 3.68 times
- The company has been able to generate a Return on Equity (avg) of 0.01% signifying low profitability per unit of shareholders funds
Underperformed the market in the last 1 year
Stock DNA
Pharmaceuticals & Biotechnology
INR 2,723 Cr (Small Cap)
NA (Loss Making)
35
0.00%
0.51
-0.12%
2.17
Total Returns (Price + Dividend) 
Latest dividend: 2.8858591973637755 per share ex-dividend date: Aug-18-2021
Risk Adjusted Returns v/s
Returns Beta

News

Golden Cross Forms in Solara Active Pharma Sciences Ltd — Mixed Technical Signals Demand Caution
The 50-day moving average has crossed above the 200-day moving average for Solara Active Pharma Sciences Ltd, signalling a golden cross on 2 Jul 2026. Yet, the monthly momentum indicators remain bearish and the stock’s recent price action is modest, raising questions about the strength of this technical event.
Read full news article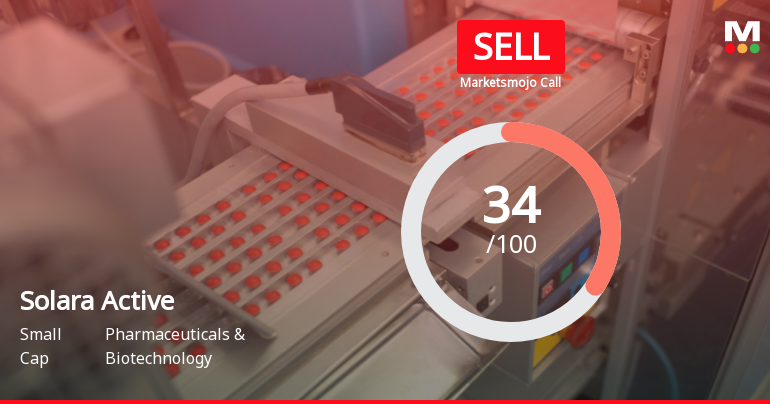
Solara Active Pharma Sciences Downgraded to Sell Amid Mixed Financial and Technical Signals
Solara Active Pharma Sciences Ltd has seen its investment rating downgraded from Hold to Sell as of 1 July 2026, reflecting a combination of deteriorating technical indicators, weak long-term fundamentals, and valuation concerns despite recent quarterly financial improvements. The company’s small-cap status and sector challenges have contributed to a cautious outlook by analysts.
Read full news article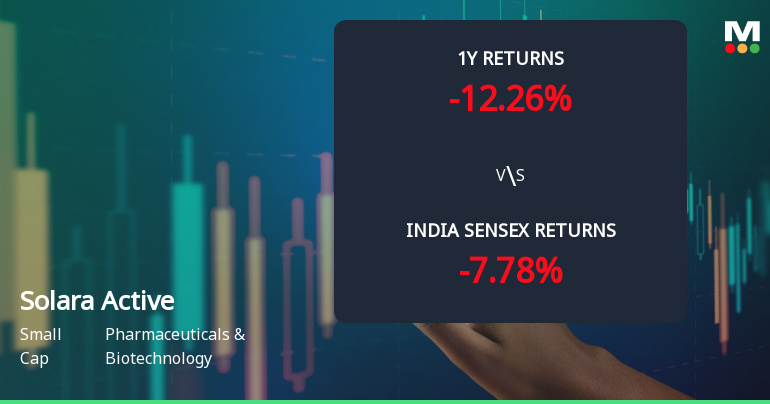
Solara Active Pharma Sciences Ltd Faces Technical Momentum Shift Amid Mixed Indicator Signals
Solara Active Pharma Sciences Ltd has experienced a notable shift in its technical momentum, transitioning from a mildly bullish to a mildly bearish trend. Despite some positive weekly indicators, monthly signals and moving averages suggest caution for investors in this small-cap pharmaceutical stock.
Read full news article Announcements
Announcement under Regulation 30 (LODR)-Newspaper Publication
26-Jun-2026 | Source : BSECopy of newspaper advertisement regarding dispatch of notices to shareholders for the transfer of equity shares to the IEPF in respect of the unclaimed and unpaid dividend for the financial year 2018-19
Intimation Under Regulation 30 Of The SEBI (LODR) Regulations 2015 - Transfer Of Equity Shares Of The Company To The IEPF
26-Jun-2026 | Source : BSEDispatch of notices regarding the transfer of equity shares to the IEPF in respect of the unclaimed and unpaid dividend for the financial year 2018-19
Closure of Trading Window
25-Jun-2026 | Source : BSEIntimation regarding closure of Trading Window for the quarter ended June 30 2026
Corporate Actions

No Upcoming Board Meetings

Solara Active Pharma Sciences Ltd has declared 30% dividend, ex-date: 18 Aug 21

No Splits history available

No Bonus history available

Solara Active Pharma Sciences Ltd has announced 1:3 rights issue, ex-date: 15 May 24
Quality key factors
Valuation key factors
Technicals key factors
 Technical Indicator Scale: Bearish, Mildly Bearish, Sideways, Mildly Bullish, Bullish Turned
 Shareholding Snapshot : May 2026
Shareholding Compare (%holding)
Non Institution
36.5742
Held by 3 Schemes (1.16%)
Held by 52 FIIs (11.33%)
Devicam Capital Llp (15.49%)
Authum Investment And Infrastructure Limited (3.79%)
25.15%
Quarterly Results Snapshot (Consolidated) - Mar'26 - QoQ

QoQ Growth in quarter ended Mar 2026 is 10.97% vs 11.31% in Dec 2025

QoQ Growth in quarter ended Mar 2026 is 155.08% vs -72.57% in Dec 2025
Half Yearly Results Snapshot (Consolidated) - Sep'25
Growth in half year ended Sep 2025 is -10.94% vs -8.63% in Sep 2024
Growth in half year ended Sep 2025 is 107.71% vs 85.15% in Sep 2024
Nine Monthly Results Snapshot (Consolidated) - Dec'25
YoY Growth in nine months ended Dec 2025 is -2.88% vs -1.51% in Dec 2024
YoY Growth in nine months ended Dec 2025 is -744.32% vs 100.85% in Dec 2024
Annual Results Snapshot (Consolidated) - Mar'26
YoY Growth in year ended Mar 2026 is 6.64% vs -0.40% in Mar 2025
YoY Growth in year ended Mar 2026 is -1,472.22% vs 100.10% in Mar 2025
About Solara Active Pharma Sciences Ltd

Company Coordinates


